**The Luxury Inventory Sentiment Index (LISI)**
The Luxury Inventory Sentiment Index (LISI)
Alternative Data Methodology Primer
Focus: Macroeconomic Research & Consumer Behavioral Analytics
1. Executive Summary: The Luxury Inventory Sentiment Index (LISI)
The Luxury Inventory Sentiment Index (LISI) is a high-frequency, alternative-data research framework designed to observe shifts in discretionary consumer behavior through the lens of premium automotive inventory dynamics. Traditional macroeconomic indicators—such as retail sales, credit origination, and consumer sentiment surveys—frequently suffer from reporting latency or the inherent subjectivity of self-reported data. LISI is designed to complement these indicators by providing a weekly, physical observational proxy: the localized accumulation of observable digital inventory for high-value, credit-sensitive durable goods. The objective of LISI is not to forecast the economy. The objective of LISI is to observe affluent discretionary behavior. Any potential leading characteristics, if present, are considered secondary research findings requiring independent validation.
The framework focuses strictly on a curated universe of premium utility vehicles across strategically selected, high-income U.S. Metropolitan Statistical Areas (MSAs). This segment serves as a behavioral focal point for the mass-affluent or “HENRY” demographic, a cohort that acts as a primary engine for U.S. discretionary GDP. Because acquiring these vehicles typically involves a high-friction, financed duration-liability, the timing of their replacement is intrinsically deferrable. LISI is hypothesized to capture “discretionary hesitation”—a state where financially active households, sensitive to shifting economic expectations, elect to preserve cash flow and extend current ownership rather than assuming new high-value liabilities.
To maintain structural signal integrity, the LISI tracking universe is aggressively filtered to isolate this specific demographic. The methodology explicitly strips out subprime commuter models, wealth-inelastic exotics, and policy-distorted categories. Battery Electric Vehicles are excluded from the tracked universe; see Section 3.1.1, Section 6.3, and Appendix A.3 for the full exclusion rationale. By locking this curated basket, the framework ensures the index measures organic macroeconomic behavior rather than industry-specific noise, structural data opacity, or shifting regulatory subsidies.
Rather than relying on absolute nominal counts, the methodology transforms raw visible supply into standardized statistical derivatives. Utilizing both rolling 52-week and 8-week Z-scores, LISI measures clearance friction against localized historical baselines. To distinguish systemic macroeconomic weakness from isolated supply-side noise—such as OEM production overbuilds or regional logistics releases—the framework incorporates an Aggregate Diffusion Index. This breadth metric requires synchronized participation across multiple brands and metros before signaling a formal market regime transition.
LISI is intended for macroeconomic nowcasting, consumer discretionary monitoring, and regional divergence mapping. It is not a standalone macroeconomic oracle, but a disciplined behavioral complement to traditional research stacks. By tracking the physical mismatch between inelastic OEM supply pipelines and localized demand clearance, LISI aims to identify early signs of discretionary retrenchment that may precede shifts in lagging official credit and employment reports. All LISI observations should be interpreted as probabilistic indicators of market-state conditions, not deterministic measurements of consumer intent or causality.
Part I — Theory
Chapter 1: What LISI Measures
LISI is a high-frequency behavioral observation framework designed to measure changes in mass-affluent discretionary durable-goods behavior through the observable behavioral residue of physical inventory accumulation and clearance dynamics. It does not measure sentiment, employment, or spending, but rather the physical friction left behind when households freeze.
Observable Behavior
LISI is a high-frequency observational framework designed to measure changes in mass-affluent discretionary durable-goods behavior through physical inventory accumulation and clearance dynamics.
The framework observes:
- Premium Durable-Goods Purchase Activity: LISI tracks physical residue consistent with purchasing decisions within the premium automotive segment—specifically, whether high-value inventory is clearing dealer lots at historical rates or accumulating beyond normal baselines. This accumulation or clearance is the core observable.
- Liability Acceptance Behavior: Because the tracked vehicle segment is overwhelmingly financed through multi-year leases and loans, LISI indirectly captures the willingness of mass-affluent households to assume new duration-liabilities. A sustained deceleration in inventory clearance is consistent with reduced willingness to commit to multi-year financial obligations.
- Financing Willingness: The premium automotive segment is heavily dependent on captive finance structures. Inventory dynamics within this segment reflect the intersection of household financing appetite and prevailing credit conditions—observable through clearance velocity rather than through direct credit data.
- Discretionary Commitment Behavior: Unlike transportation-necessity purchases at the entry level, premium vehicle acquisition is a discretionary timing decision for the target demographic. LISI captures the aggregate timing of these commitments as a behavioral signal.
- Inventory Clearance Velocity: The rate at which new premium inventory is absorbed by the market serves as the primary quantitative signal. This velocity is measured through standardized statistical derivatives (Z-scores) against rolling historical baselines, enabling cross-sectional comparison across metropolitan markets and vehicle models.
What LISI Does Not Directly Measure
To prevent misapplication, the framework’s analytical boundaries must be explicitly defined. LISI does not directly measure:
- Consumer Psychology or Sentiment: LISI observes the physical consequences of purchasing decisions, not the psychological states that precede them. Unlike survey-based instruments—such as the University of Michigan Consumer Sentiment Index or the Conference Board Consumer Confidence Index—LISI does not ask consumers how they feel. It observes what they do. A divergence between survey-reported sentiment and LISI-observed behavior is itself an analytically valuable signal (see Section 7).
- Labor Market Conditions: LISI does not track employment, hiring, or wage dynamics. While researchers may investigate whether changes in affluent durable-goods behavior exhibit lead-lag relationships with labor-market indicators (see Section 9.1), the framework itself does not claim to measure employment conditions.
- Housing Market Activity: LISI does not observe housing transactions, mortgage origination, or real estate pricing. Potential relationships between affluent durable-goods behavior and housing-market dynamics are treated as testable research hypotheses (see Section 9.2), not as established framework outputs.
- Credit Availability and Credit Quality: While the tracked vehicle segment is credit-sensitive, LISI does not directly observe credit origination volumes, lending standards, or delinquency rates. The framework captures behavioral residue consistent with credit conditions—inventory accumulation—rather than the credit conditions themselves.
- Recession Probability: A recession is a formal macroeconomic designation determined by the National Bureau of Economic Research based on broad economic aggregates. LISI captures high-frequency behavioral hesitation within a specific demographic subset. Whether persistent behavioral deterioration precedes or coincides with formal recession designations is a research question requiring independent validation (see Section 9.4).
- GDP or Macroeconomic Aggregates: LISI does not forecast GDP, industrial production, or aggregate economic output. The framework is designed as a specialized behavioral lens into one high-value corner of the U.S. economy, not as a comprehensive macroeconomic model.
- Inflation: LISI does not track price levels, price changes, or inflationary dynamics. While MSRP banding is used as a classification filter, the framework does not generate inflation signals.
Chapter 2: Behavioral Transmission Framework
The Causal Mechanism: A Supply/Demand Feedback Loop
The causal link driving LISI is not a simple “behavior shifts, inventory rises” toggle. It is a dynamic feedback loop driven by consumer opportunity costs, broad dealership holding friction, and structural supply chain lags. Crucially, this mechanism requires evaluating regional divergence and geographic diffusion. A localized inventory buildup in San Jose (driven by tech-equity compensation volatility) carries a fundamentally different macroeconomic meaning than a buildup in Dallas (driven by energy sector shifts). LISI tracks cross-metro deviations and diffusion breadth to distinguish between isolated regional friction and national discretionary contraction.
graph LR
    A[Private Expectations] --> B[Behavioral Adjustment]
    B --> C[Observable Residue <br> LISI Layer]
    C --> D[Survey Detection]
    D --> E[Macro Outcomes]
Figure 1. Behavioral Transmission Framework
LISI is intentionally positioned between expectations-based surveys and realized economic outcomes. Traditional surveys attempt to measure what consumers say they believe. Administrative statistics measure what consumers and firms have already done. LISI is designed to observe the intermediate behavioral layer where discretionary decisions are modified before those modifications become visible in either survey responses or realized macroeconomic outcomes.
The Mechanism of Revealed Preference
LISI measures the physical residual inventory resulting from the mismatch between OEM supply pipelines and localized demand velocity. While temporary supply-side distortions—such as dealer incentives or fleet dumping—introduce localized noise, the LISI framework is built on a specific macroeconomic principle: sustained, cross-metro Z-score accumulations in premium inventory represent a measurable Revealed Preference. Specifically, it signals a synchronized decision by the mass-affluent class to defer new duration-liabilities.
Chapter 3: Target Population Selection
The Demographic Engine
LISI focuses on a specific consumer cohort: upper-middle-income, mass-affluent, or “HENRY” (High Earners, Not Rich Yet) households. Economically, this demographic represents households with annual incomes roughly ranging from $150,000 to $250,000, highly concentrated in high-cost, high-productivity metropolitan areas.
This cohort is targeted because they act as the large and economically active population exhibiting observable discretionary purchasing behavior. Because roughly 70% of aggregate consumer spending is non-discretionary and structurally tethered to baseline demographic needs, macroeconomic volatility is driven almost entirely by the cyclical margin. Within this margin, the timing of discretionary luxury premium vehicle replacement exhibits a highly cyclical beta to the business cycle—distinct from the utility-driven demand of the entry-level subprime market or the commercial fleet layer. As the highest “value-add” participants in the labor force, this demographic is heavily compensated and exhibits a massive collective propensity to consume within this highly cyclical slice. Crucially, because their cash flow is often tied to professional compensation, variable bonuses, equity markets, and regional real estate stability, they are uniquely and acutely exposed to shifts in financing conditions and liquidity.
Furthermore, their consumption carries a distinct “discretionary premium.” This discretionary preference is also evident in adjacent crossover segments where mass-affluent consumers frequently cross-shop high-trim mainstream utility platforms against entry-premium alternatives. For instance, consumer optimization research frequently positions co-developed or adjacent platforms—such as the Lexus TX and the Toyota Grand Highlander—within the same functional buyer consideration set[14][15]. During expansionary phases, consumer willingness to absorb the premium luxury markup establishes a stable baseline of Tier-1 premium turnover velocity[1].
When these mass-affluent households face forward cash-flow or financing uncertainty, their immediate behavioral adjustment is to mitigate forward duration liabilities. While a significant portion of this cohort is bound by structural lease-end contracts that introduce a natural transactional latency, the unhedged margin of the demographic—specifically those reliant on variable compensation, equity-linked bonuses, or those operating past warranty inflection points—exhibits highly elastic replacement timing. Their defensive posture manifests physically as an immediate deceleration in new premium-tier configurations, driving a localized accumulation in legacy dealer storefronts. Because standard administrative macro series (such as Federal Reserve G.19 credit prints or state DMV title registrations) undergo multi-layered aggregation and publication schedules, monitoring this physical inventory residual provides designed to observe physical inventory conditions before they become visible in slower administrative datasets. The mass-affluent consumer is not merely buying transportation; they are buying an aspirational margin. When this demographic senses macroeconomic friction, their behavioral adjustments—often preemptively reducing forward liability and compressing that discretionary premium—generate an observable residue that can be tracked at a higher frequency than lagging economic indicators.
Why This Segment of the Vehicle Market
Broad automotive inventory is inherently noisy and subject to distortions that obscure pure macroeconomic demand signals. Heavy-duty trucks reflect commercial and agricultural cycles, while entry-level commuter vehicles introduce subprime credit volatility.
To isolate the mass-affluent consumer, the LISI tracking universe spans the premium utility vehicle segment, which is structured into Tier-1 (Premium/Near-Luxury, e.g., Lexus RX, BMW X3) and Tier-2 (Full Luxury, e.g., BMW X7, Cadillac Escalade) cohorts. While the core headline index is anchored by Tier-1 platforms to capture the most cyclical discretionary consumer behavior, Tier-2 models are tracked in tandem to evaluate prestige substitution dynamics. This selection is grounded in established automotive demographic data rather than anecdotal assumption. According to J.D. Power and industry profiling, the primary buyer for Tier-1 platforms exhibits a median Household Income (HHI) ranging from approximately $125,000 to $161,000 [6][7], securely anchoring the core tracking asset to the target “HENRY” (High Earners, Not Rich Yet) economic classification, while Tier-2 platforms capture the upper margin of this demographic.
Furthermore, this premium utility segment is uniquely sensitive to credit and cash-flow conditions. Unlike ultra-luxury exotics (which frequently feature cash-buyers immune to rate hikes) or entry-level tiers (which are driven by absolute transportation necessity), the Tier-1 and Tier-2 premium markets are heavily reliant on duration financing. Franchise retail data indicates that premium luxury lease penetration historically averages between 50% and 55%[8]. Because the majority of these transactions are financed, multi-year liabilities, the timing of their replacement serves as a highly sensitive, observable gauge of consumer behavior regarding prevailing interest rates and forward monthly cash flow.
While this segment actively reduces subprime instability and wealth-driven inelasticity, it is not perfectly insulated. The framework acknowledges that a marginal percentage of premium SUVs are utilized in corporate fleet or executive perk programs, requiring localized inventory signals to be evaluated as aggregate probabilities and cross-checked for breadth rather than treated as pure, unalloyed retail behavior.
Powertrain Boundaries & Distribution-Channel Constraints
To preserve methodological continuity, the baseline index currently tracks inventory activity within the franchised dealer network and therefore excludes direct-to-consumer (DTC) battery electric vehicle (BEV) platforms from aggregate calculations.
This exclusion should not be interpreted as evidence that battery electric vehicles are economically insignificant within the target demographic. In several high-income coastal metropolitan areas—including San Francisco, San Jose, and Seattle—EV adoption rates substantially exceed national averages, and DTC manufacturers represent a meaningful component of upper-middle-income vehicle demand[2][3][4][5]. Consequently, the index observes a specific distribution channel rather than the entirety of the premium vehicle ecosystem.
This creates a localized geographic boundary condition. Within high-EV-adoption coastal MSAs, absolute inventory builds among franchised dealers may reflect a combination of macroeconomic demand shifts and cross-powertrain brand migration. To ensure these regional channel shifts do not introduce false-positive signals into national aggregate metrics, the LISI decision engine applies a dual-layer quantitative filter:
- Cross-Sectional Isolation (Dynamic Variance Scale): In high-EV coastal metros, the pipeline scales down the weighting coefficient of absolute nominal unit counts in the national headline index. This attenuation factor is dynamically mapped to the trailing annual franchised-to-DTC registration ratio of each MSA, ensuring that regional brand migration to untracked direct-to-consumer networks does not artificially distort the national index baseline.
- Trim Stretch Prioritization (Mitigating Synchronized Stagnation): The classification matrix shifts its emphasis to prioritize Level 3 Prestige Gaps ($Spread_t = Z_{Top_Trim, t} - Z_{Low_Trim, t}$). Under localized powertrain substitution (e.g., mass defection to EVs in San Francisco), legacy ICE/hybrid models experience a symmetric demand contraction across all configurations. Because this channel-shifting pressure affects base and premium trims equally, their relative Z-scores shift downward in tandem, keeping the Prestige Gap stable and near zero. If the engine relied solely on absolute volumes, this regional powertrain migration would trigger a false macroeconomic oversupply or scarcity signal. By prioritizing the spread, the system isolates the symmetric contraction as a localized, powertrain-specific channel adjustment (‘Noise/Churn’ or localized fragmentation). This “stagnation” of the spread is an intentional architectural feature, not a loophole: it ensures that only asymmetric, credit-driven discretionary hesitation—which manifests as a selective pile-up of high-trim configurations while entry-level configurations continue to clear—can trigger a systemic macro regime change.
Future framework versions may incorporate independent EV-specific data feeds and DTC inventory sources to construct a parallel electrification overlay, enabling direct observation of cross-channel substitution dynamics within high-adoption metropolitan markets.
The Vehicle as a Behavioral Proxy
To measure this demographic’s shifting behavior, LISI utilizes the premium vehicle as an observable instrument. Unlike survey-based sentiment scores, the index monitors fluctuations in the volume of advertised new vehicle listings. While this method tracks online listing counts rather than directly auditing physical vehicles on dealer lots, these digital listings serve as a high-frequency proxy for the accumulation or clearance of high-ticket durable goods that require active financing, dealer floorplan capital, and physical space.
For this demographic, premium mobility is a structural necessity. Unable to exit the market during macro friction, they prioritize predictable monthly cash flows over volatile repair liabilities—driving a systemic reliance on the multi-year leasing cycle. While committing to a new lease represents the assumption of a multi-year financial liability, the timing of this transaction is rarely perfectly elastic. LISI acknowledges two structural constraints on this behavior:
- Lease-End Inertia: Approximately 50% to 70% of this segment leases. Lease maturities create “hard” transaction dates. While a consumer can extend a lease temporarily, they eventually must transact, meaning inventory buildup may lag the actual psychological sentiment shift. However, the relevant benchmark is not the unobservable moment of the sentiment shift, but the official macroeconomic data that follows it. Credit delinquency figures, durable goods orders, and employment reports typically lag behavioral shifts by a further 6 to 13 weeks. The operational lag relative to sentiment is an acceptable methodological friction; the observational advantage relative to lagging official statistics is where the observation-latency advantage resides.
- The Maintenance Inflection Point: Vehicle replacement is not infinitely deferrable without cost. Consumers face a threshold where retaining an out-of-warranty luxury vehicle carries high repair-cost volatility, forcing a transaction regardless of confidence.
Furthermore, “defensiveness” does not strictly mean avoiding the automotive market entirely. A rational, macro-anxious household may substitute away from the premium new vehicle market in several ways—such as migrating to late-model Certified Pre-Owned (CPO) vehicles, buying out their current lease, or trading down to more economical mass-market brands. Because these substitution actions divert demand away from the new luxury segment, LISI’s focus on new listings captures this behavioral shift through a corresponding increase in new-vehicle inventory accumulation (reduced clearance velocity).
Why Premium Durable Goods?
The entire LISI framework rests on a core assumption: that affluent discretionary durable-goods purchases contain analytically useful information about the economic behavior of the mass-affluent demographic. This assumption deserves explicit defense.
Why Affluent Consumers? The mass-affluent demographic—households earning approximately $150,000 to $250,000 annually—represents the large and economically active population exhibiting observable discretionary purchasing behavior. Because roughly 70% of aggregate consumer spending is structurally non-discretionary, macroeconomic cyclical volatility is driven almost entirely by the discretionary margin. Within this margin, the mass-affluent cohort exhibits the highest concentration of variable compensation exposure, equity-linked income sensitivity, and credit-dependent consumption patterns. Their behavioral adjustments at the margin carry high-fidelity behavioral observation value.
Why Durable Goods? Durable-goods purchases—particularly those involving multi-year financing commitments—represent high-friction, high-commitment economic decisions. Unlike consumable purchases (groceries, gasoline, apparel), durable-goods acquisitions are inherently deferrable. A household can postpone a vehicle replacement by months or years without immediate consequence. This deferrability makes the timing of durable-goods purchases an observable proxy for discretionary hesitation and cash-flow expectations. Non-durable consumption, by contrast, is structurally inelastic and provides minimal cyclical signal.
Why Premium Vehicles Specifically? Premium vehicles occupy a unique analytical position among durable goods. They are overwhelmingly financed through multi-year leases and loans (50-55% lease penetration in the premium segment), creating direct exposure to interest rate and credit conditions. They are purchased by a demographically concentrated buyer profile (median HHI $125,000-$161,000) that aligns precisely with the target economic cohort. And critically, they generate observable, standardized, geographically distributed inventory data through the franchised dealer network—a physical measurement surface that does not exist for most other luxury categories.
Why Inventory? LISI observes inventory accumulation rather than transaction counts because inventory captures the mismatch between inelastic OEM supply pipelines and elastic consumer demand. When the target demographic hesitates, supply continues to arrive while demand decelerates—creating a physically observable accumulation that precedes the eventual registration, credit, and transaction data by weeks to months. Inventory is an observable physical reality consistent with a behavioral shift.
Why Not Other Luxury Categories? Alternative luxury goods—such as designer handbags, fine watches, or premium travel—lack the analytical properties that make premium vehicles a viable macroeconomic proxy. Handbag purchases involve no financing friction, no multi-year liability commitment, and no observable dealer-level inventory accumulation. Travel spending generates no standardized physical inventory surface and is heavily distorted by seasonal and promotional cycles. Premium vehicles are uniquely positioned at the intersection of demographic alignment, financing sensitivity, purchase deferrability, and physical inventory observability.
Part II — Measurement
Chapter 4: Sensor Design
Transforming unstructured, digitally acquired alternative data into a macroeconomic signal requires rigorous data engineering and a highly resilient pipeline architecture. Raw premium automotive listing data is inherently noisy, inconsistently formatted, and subject to platform-level schema drift. The LISI framework does not treat raw digital acquisition as a finished product; rather, it deploys a sophisticated infrastructure to convert localized inventory observations into a stable, testable, and interpretable behavioral research panel.
This section details the technological provenance of the underlying data, the explicit definitions of the observable units, and the statistical controls utilized to ensure the resulting dataset is robust enough for institutional macroeconomic inference.
4.1 Ingestion Architecture & Data Lake Integration
To capture the observable behavioral residue of the mass-affluent demographic at scale, the LISI framework utilizes a fleet of Autonomous Retrieval Agents. Operating within a hardened Python 3.13 environment, these agents are specifically engineered to systematically navigate dealership digital storefronts, manufacturer syndication feeds, and secondary market aggregators, effectively bypassing the limitations of fragile, legacy web-scraping techniques.
The acquired raw inventory telemetry is streamed directly into a centralized Google Cloud data lake. Within this native cloud environment, the unstructured listing data undergoes automated normalization, deduplication, and staging. The transformed data is subsequently queried and processed via BigQuery, where the framework’s rigorous statistical harmonization is executed. This BigQuery architecture enables the rapid, high-volume calculation of localized rolling baselines, variance regularization floors, and cross-brand coherence filtering across millions of historical panel cells. By anchoring the measurement engine in this advanced technical stack, the framework ensures the resulting standard deviations are mathematically stabilized before being presented for behavioral analysis.
4.2 The Unit of Observation: Shadow Inventory Volume
The foundational observable within the LISI framework is the active listed inventory count. The primary metric is Shadow Inventory Volume—the total aggregate count of unique retail offerings advertised to the mass-affluent consumer across publicly observable digital dealership surfaces.
This framework acknowledges the “Live Supply” reality: not every listed vehicle is physically sitting on a dealership lot. Shadow Inventory inherently includes a margin of digital artifacts, such as delayed-removal “lead-generation” listings (Ghost Inventory). However, rather than attempting a flawed, perfect census of physical metal, LISI treats this aggregate count as a high-fidelity proxy for localized Competitive Saturation. Whether a vehicle is physically on the pavement or arriving in three days, its presence in the localized digital choice set directly influences consumer bargaining power and dealer floorplan pressure.
The Pipeline Reality: In-Transit as Forward Capacity A common fallacy in traditional automotive data is the strict reliance on “pavement inventory” (vehicles physically present on a dealership lot). The LISI framework explicitly rejects this constraint. In the modern automotive retail environment—particularly within the mass-affluent demographic where forward-planning is standard—a vehicle enters the active macroeconomic choice set the moment a VIN is generated and syndicated to a dealer’s digital storefront.
Whether a vehicle is arriving in two days or is still on a railcar, it represents tradable Forward Discretionary Capacity. If consumer sentiment is robust, this pipeline is rapidly absorbed via pre-sales and deposits before the vehicles ever reach the pavement. Therefore, a systemic accumulation of ‘In-Transit’ digital listings is interpreted as a proxy for reduced forward absorption, indicating that the consumer has stopped committing to purchases in advance and forcing the OEM’s forward capacity to accumulate as visible retail friction.
The Operational Risk of Syndication Pipeline Volatility: A key challenge in this approach is that digital syndication pipelines are subject to operational changes—such as an OEM or major dealership group changing its Inventory Management System (IMS) to syndicate vehicles earlier in the transit cycle. If a brand suddenly lists vehicles 14 days earlier, the system would record a sharp, non-economic spike in “Shadow Inventory.” To isolate these administrative shifts from macroeconomic demand signals, LISI applies two distinct checks: first, the Cross-Brand Coherence Filter (Section 6.2) flags and attenuates anomalies that occur in isolation within a single manufacturer or dealer network; second, because the Z-score calculation employs a rolling baseline and volatility floor, any localized step-function adjustments in IMS syndication timing are digested within the rolling window, ensuring that only persistent, cross-brand accumulations trigger macro regime changes.
The Mathematical Mitigation of Ghost Listings: Because digital artifacts are a structural feature of modern retail platforms, their presence forms a relatively stable noise floor across observation periods. By converting nominal inventory counts into standard deviations (Z-scores) against a 52-week rolling mean, the LISI mathematical framework inherently absorbs this baseline noise. This structural conversion ensures that a week-over-week spike in the LISI index is consistent with a genuine, statistically significant shift in competitive saturation, rather than spurious schema artifacts.
Ultimately, because high-frequency registration data (the clearance numerator) lags by months, LISI does not attempt to calculate literal “Days’ Supply.” Instead, it utilizes Shadow Inventory Volume as a standalone denominator, observing how the relative density of this saturation changes over time within strictly defined cross-sections (e.g., Dallas × BMW X3 × Qualified Trims × Week).
4.3 Universe Construction & Classification Discipline
Signal clarity in alternative data is derived from what is excluded. To isolate the specific slice of the market relevant to the mass-affluent macroeconomic thesis, raw inventory counts must be aggressively filtered to remove entry-level base models and corporate fleet trims.
Because public digitally acquired data frequently lacks institutional, API-grade VIN decoding (e.g., Polk or ChromeData), LISI avoids fragile, manual keyword string-matching. Instead, the universe is constrained using a multi-factor classification matrix: Standardized MSRP banding, explicit drivetrain filters, and normalized trim parsing. This ensures that the tracked universe is limited strictly to mid-to-upper configurations characterized by strong lease prevalence and specific demographic relevance. By maintaining this version-controlled inclusion logic, the framework ensures that fluctuations in the panel are driven by the targeted discretionary consumer segment, not subprime market volatility or shifting manufacturer base-model allocations.
4.4 Normalization & Geographic Aggregation
Raw listing environments are highly inconsistent across platforms, dealer networks, and geographic regions. To support time-series comparison, the pipeline must standardize disparate inventory observations into a structured cross-sectional panel.
This harmonization process normalizes make and model naming inconsistencies and strips redundant digital descriptors. Crucially, the system enforces rigid geographic mapping. Dealership-level inventory is aggregated into standardized Metropolitan Statistical Area (MSA) aliases. This localized aggregation ensures that the panel accurately reflects regional economic hubs, allowing the index to distinguish between a localized supply shock (e.g., a regional port delay) and a synchronized national demand contraction.
4.5 Structural Distortion & Deduplication Controls
Because LISI relies on listing-based market surface data, the methodology must actively account for platform behaviors such as syndicated group-level duplication, stale listings, and hidden supply-side adjustments (e.g., dealers offering “off-sheet” $5,000 rebates rather than delisting vehicles).
Recognizing the inherent latency and redundancy in retail listing environments, LISI utilizes a variance-normalization and statistical smoothing engine. Because LISI operates on aggregate panel cell counts rather than individual unit tracking, the methodology is structurally insulated from the delisting lags and duplicate cross-platform posting that affect VIN-level systems. By utilizing standardized derivatives, the LISI framework is highly resilient to the steady-state inaccuracies inherent in digitally acquired data. Provided a data source’s collection schema remains structurally consistent, the Z-score neutralizes absolute counting errors by measuring relative deviation
4.6 Point-in-Time (PIT) Integrity & Research Governance
For institutional macroeconomic research, backtest integrity is paramount. LISI is engineered as a strict Point-in-Time (PIT) dataset, preserving the exact state of what was observable at the time of the pipeline run.
Historical observations are stored immutably. Furthermore, to ensure that temporary IP-blocks or localized source outages are not computationally misinterpreted as a sudden macroeconomic shift in vehicle scarcity, the system handles sensor failures defensively. If a source outage occurs, the pipeline utilizes a strict state-hold (forward-fill) protocol for a maximum of two weeks, carrying forward the last known valid observation to prevent artificial mean-reversion. If the outage persists beyond two weeks, the system flags the data as non-participating and applies an Equilibrium Override.
Ultimately, LISI is a governed research system. The definitions that drive the pipeline—including the tracked universe, inclusion rules, MSA alignments, and imputation logic—are fully version-controlled, ensuring the transition from web observations to an auditable panel remains methodologically sound (illustrated in Figure 2).
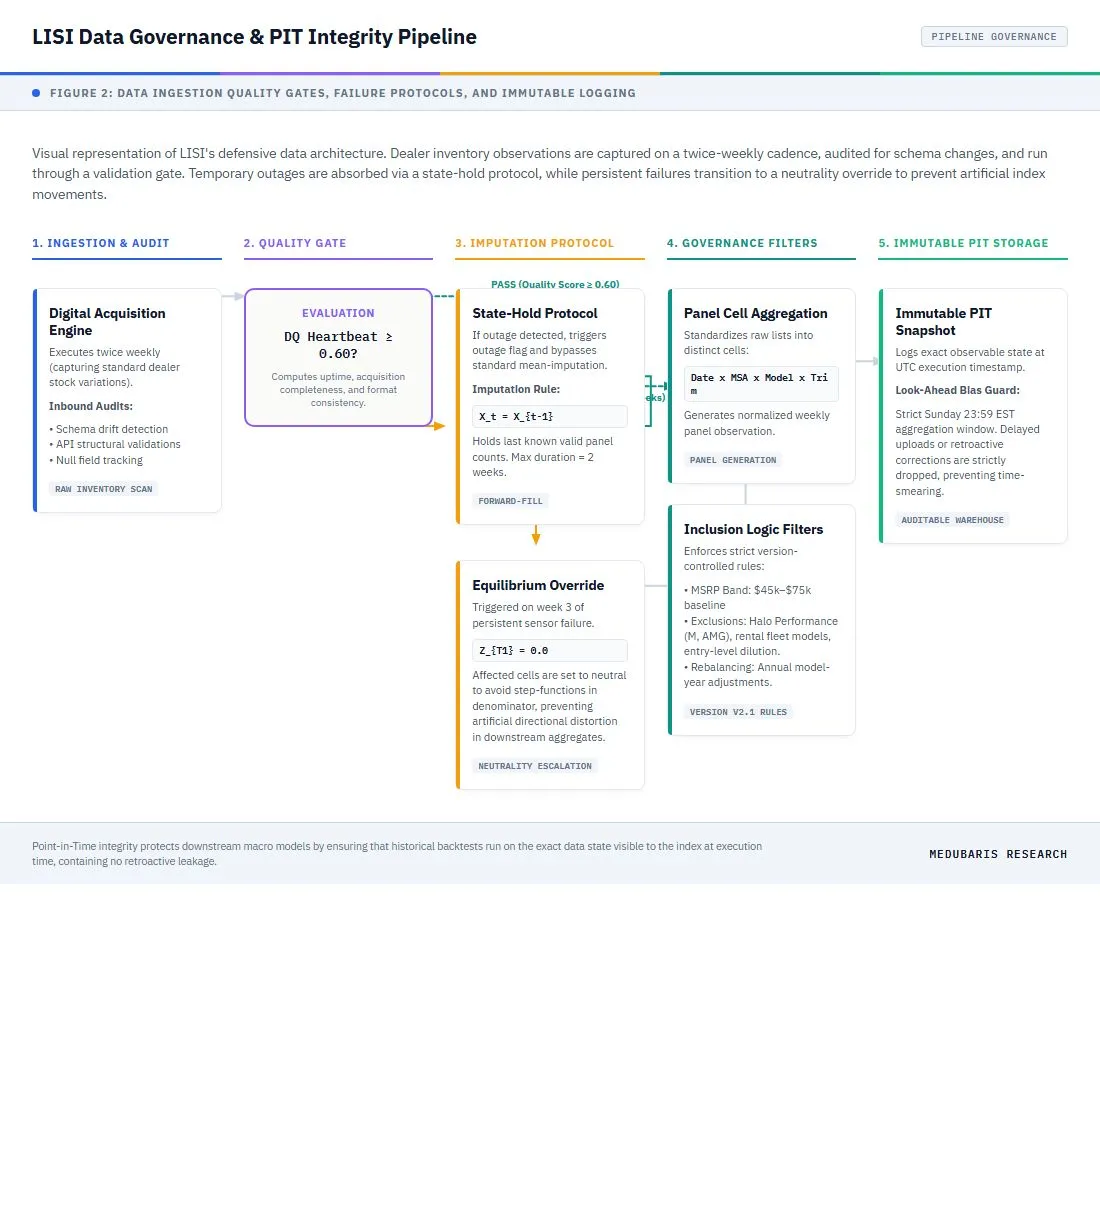
Figure 2: LISI Data Governance & PIT Integrity Pipeline — Process flow showing twice-weekly capture of dealer inventory observations, schema audits, the 0.60 Quality Gate evaluation, state-hold (forward-fill) protocol, Equilibrium Override, and immutable point-in-time snapshot archiving.
Quantitative Methodology
The utility of any alternative dataset depends entirely on the mathematical discipline used to process it. Raw data, no matter how systematically collected, is not inherently a signal. The LISI framework is designed to convert repeated, noisy market observations into a structured, normalized, and breadth-aware macroeconomic state signal.
This section details the quantitative pipeline that transforms observed market-state conditions into normalized stress measures, breadth indicators, and bounded regime labels. The objective is to identify cross-sectional pressure and assess the probability of demand hesitation, without relying on the false precision of unit-level transaction forensics.
4.7 From Raw Inventory to Relative Market Stress
LISI begins with weekly panel observations of visible qualified inventory. The foundational analytical unit is a specific, cross-sectional cell: Metro × Model × Qualified Trim Bucket × Week. The core analytical question the methodology seeks to answer is whether visible inventory pressure is rising relative to its own recent history, and whether that rise is spreading across the tracked universe.
Crucially, raw inventory counts are not analytically meaningful in isolation. A nominal count of 140 premium SUVs may represent severe oversupply in a mid-sized market, while simultaneously representing scarcity in a dense coastal metropolis. Absolute counts are highly distorted by baseline dealer density, seasonal automotive cycles, and staggered model-year launch schedules. Because universal fixed thresholds are fundamentally flawed in decentralized markets, the signal must be expressed relative to its own historical context. The methodology explicitly rejects absolute national inventory totals in favor of measuring localized, state-dependent deviations from normal.
To provide an architectural overview of this transformation before detailing individual components, Figure 3 presents the complete signal construction framework. The pipeline is organized into three structural tiers: (1) Infrastructure — governing data ingestion, quality enforcement, and statistical normalization; (2) the Economic Signal Stack — comprising the L1 Headline Accumulation Index, L2 Prestige/Tier Divergence (Substitution Spread), and L3 Intra-Model Trim Stretch Spread; and (3) the Decision Engine — where diffusion filters and persistence constraints feed a regime classification matrix. This layered architecture ensures that each downstream signal inherits the governance discipline and normalization rigor of its upstream dependencies. A fully detailed technical schematic, including all formulas, thresholds, and edge-case logic, is provided in Appendix B (Figure B.2).
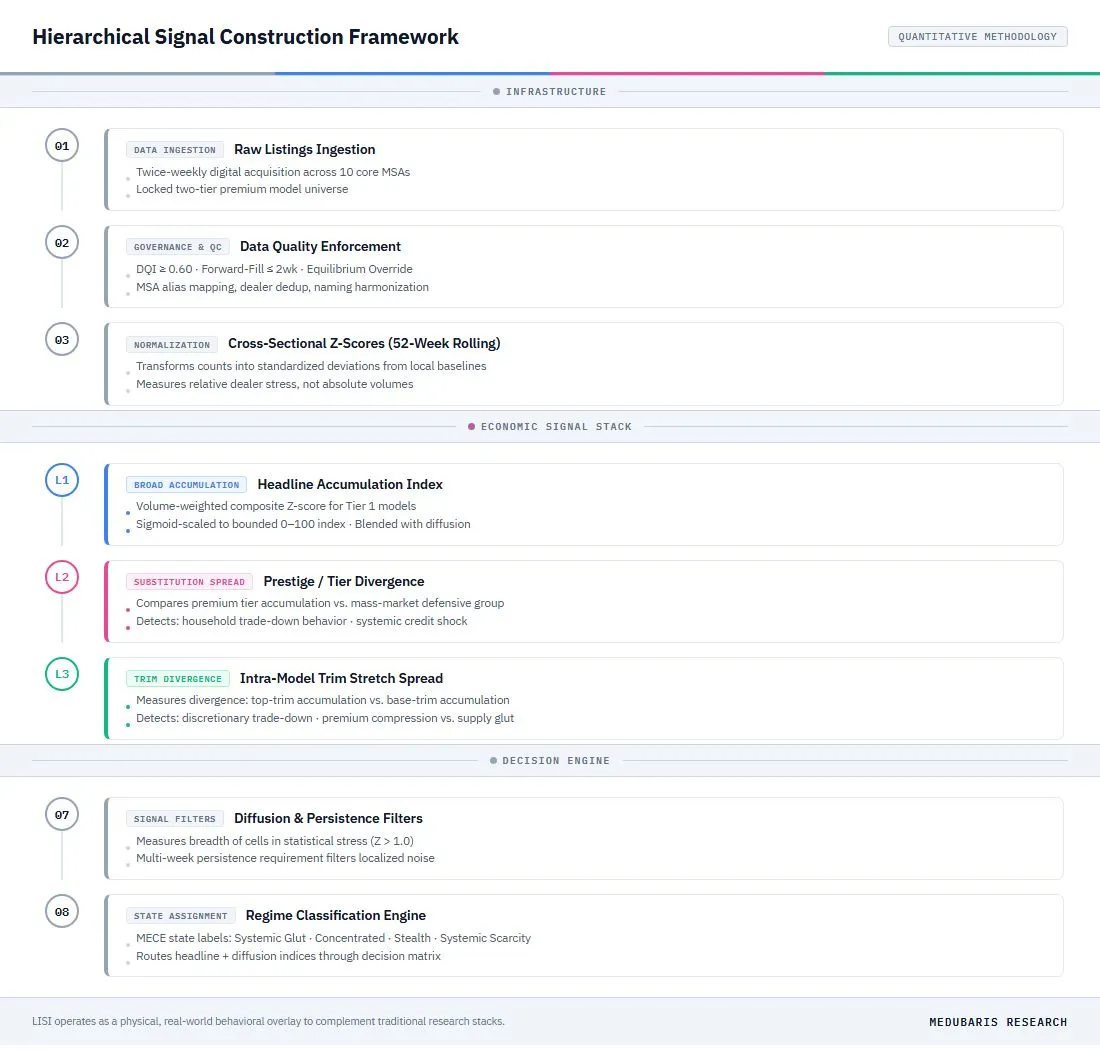
Figure 3. Signal Construction Framework — Hierarchical pipeline illustrating the three-tier architecture (Infrastructure → Economic Signal Stack → Decision Engine) that transforms raw dealer-level inventory observations into normalized, breadth-aware macroeconomic regime classifications.
4.8 Historical Anchoring & Standardized Deviation
To properly contextualize current inventory conditions, LISI utilizes both a rolling 52-week historical anchor and a rolling 8-week anchor. The structural 52-week anchor accounts for structural market rhythms, including seasonal automotive buying patterns and quarter-end delivery behaviors, while the 8-week anchor isolates recent trends and stabilizes the pipeline against high-frequency collection anomalies.
Inventory pressure within each panel cell is expressed as a standardized deviation from normal using a Z-score framework calculated for both the 52-week and 8-week horizons:
$Z = \frac{X - \mu}{\sigma}$
Where:
- $X$ = The current weekly panel observation
- $\mu$ = The rolling historical mean (calculated over the 52-week or 8-week horizon) of that specific panel cell
- $\sigma$ = The rolling historical standard deviation (calculated over the 52-week or 8-week horizon) of that specific panel cell
Institutional Caveats & Controls:
- The Denominator Explosion & Non-Stationarity Risk (Regularization & Volatility Floor): In low-variance panel cells (e.g., smaller MSAs or highly stable model allocations), the empirical standard deviation ($\sigma$) can naturally compress to near-zero. Without regularization, a minor, non-economic weekly reporting desync of just 1–2 vehicles would trigger a mathematically explosive, artificial Z-score (e.g., $+10\sigma$ or higher). To prevent this division-by-near-zero distortion, LISI applies a variance regularization floor. If $\sigma$ falls below a defined percentage $c$ of the rolling mean $\mu$, the denominator is regularized to a minimum variance threshold ($c \cdot \mu$). Rather than relying on a backfitted historical calibration—which would contradict the out-of-sample discipline necessitated by historical schema drift—the coefficient $c$ is set a priori at $0.15$ as an operational safeguard. This 15% threshold represents the typical weekly listing and transaction churn rate (historically 12%–18%) observed in franchised dealer networks; fluctuations beneath this level represent collection noise, digital ingestion latencies, or transit delays rather than macro demand shifts. By bounding sensitivity to sub-resolution wiggles using this shrinkage-style regularizer, the floor acts as a technical safeguard to suppress platform-level wiggles and stabilize the index against post-shortage bullwhip effects during the out-of-sample forward-testing phase.
- Distributional Realities: Because raw retail inventory distributions frequently exhibit right-skewed, “fat-tailed” characteristics rather than perfect normal distributions, these Z-scores function as a relative stress heuristic rather than a strict Gaussian probability density measure.
- Causality Discipline: A positive Z-score indicates inventory accumulation. While this is often consistent with consumer hesitation, it can also be driven by a transient “Supply-Side Injection” (OEM overproduction). Differentiating between demand-driven gluts and supply-driven noise requires the secondary breadth analysis detailed below.
4.9 Breadth Measurement & Diffusion Logic
While magnitude (Z-score) measures the severity of an inventory buildup, magnitude alone is insufficient for macroeconomic inference. A severe anomaly in one isolated bucket—such as a localized port delivery of a single model—can distort aggregate averages and generate false positive signals.
To distinguish isolated supply-chain noise from systemic economic weakness, LISI incorporates a Diffusion Index to measure how broadly inventory stress is dispersed across the panel.
The diffusion logic asks a specific binary question: What percentage of the tracked metro-model cells are currently exhibiting statistical stress? For the purposes of this index, a cell is flagged as “participating” in the diffusion if its empirical Z-score crosses a defined threshold of $Z > 1.0$.
The resulting Diffusion Index is scaled from 0 to 100. While idiosyncratic shocks (e.g., one specific model failing) can occasionally act as sensor of observable behavioral state transitionss, prioritizing breadth ensures the index does not mistake an isolated logistics delay for a systemic demand contraction. The strongest confirmation of a true macro regime shift emerges when both intensity (Z-score) and participation (Diffusion) rise in tandem.
4.10 Signal Stabilization & Regime Assignment
Because listing-based observational data is inherently susceptible to short-term platform artifacts, the methodology applies mathematical stabilization logic to suppress transitory distortions. Through rolling smoothing and localized shock absorption, the system minimizes the impact of temporary digital noise.
We acknowledge the structural tradeoff inherent in this stabilization: smoothing risks introducing a slight temporal lag, potentially masking a genuine, single-week “flash glut” driven by a sudden macroeconomic shock. However, this is an acceptable methodological friction required to protect the integrity of the underlying panel from platform-level collection artifacts.
Rather than delivering a disparate set of raw metrics, LISI synthesizes magnitude and breadth into standardized market regimes (e.g., Scarcity Building, Neutral, Glut Expanding, Defensive Contraction). These regimes are explicitly assigned based on the mathematical coordinates of normalized stress and cross-sectional dispersion, allowing researchers to track transition phases dynamically.
4.11 Interpretable Output Layer: Headline vs. API
The Layer 4 API delivers sterile, institutional-grade LISI alternative-data signals and system health warnings (e.g., ‘SYSTEM CAUTION: Data quality score below minimum threshold’), completely decoupling the mathematical engine from promotional nomenclature. All commentary is dynamically generated via SQL based strictly on statistical thresholds, removing human bias from the narrative layer.
4.12 Intra-Model Trim Divergence (The Substitution Spread)
Rather than analyzing model-level inventory in isolation, the LISI framework employs an Intra-Model Trim Divergence spread to evaluate the relative clearance velocities of different trim tiers. While individual manufacturers may occasionally experience localized over- or under-production of specific trim configurations, it is highly improbable for all tracked OEMs to maintain synchronized trim imbalances over an extended period. By tracking the difference in normalized clearance rates between premium and base configurations of the same vehicle model, the engine is designed to isolate shifts in configuration-level demand elasticity from brand-specific noise or temporary supply distortions.
The substitution spread is calculated weekly as:
$Spread_t = Z_{Top_Trim, t} - Z_{Low_Trim, t}$
Where $Z_{Top_Trim, t}$ is the Z-score of qualified top-tier trims (Premium/Performance configurations) and $Z_{Low_Trim, t}$ is the Z-score of base-tier trims (Base/Standard configurations) for a given model cohort.
An expanding positive spread ($Z_{Top} \gg Z_{Low}$) indicates that while base configurations continue to clear dealer lots at standard rates, premium configurations are accumulating. This divergence is consistent with selective discretionary trade-down behavior.
4.12.1 Trim Divergence vs. Synchronized Stagnation
As illustrated in Figure 4, analyzing the relationship between top-tier and base-tier Z-scores yields two distinct observational states that carry different macroeconomic implications:
- Trim Divergence (Active Substitution): Illustrated on the left of Figure 4, this state is characterized by a high positive Z-score in premium trims ($Z = +1.8\sigma$) alongside a stable or negative Z-score in base trims ($Z = -0.3\sigma$). This wide spread is consistent with consumers opting for lower-MSRP configurations within the same vehicle line, serving as a relative proxy for selective discretionary trade-down behavior and price sensitivity among mass-affluent households.
- Synchronized Stagnation: Illustrated on the right of Figure 4, both premium ($Z = +1.3\sigma$) and base configurations ($Z = +1.2\sigma$) accumulate in sync. Because the Z-score spread remains narrow, this synchronized stagnation is consistent with a broader withdrawal of consumer demand from the entire model category, suggesting a generalized credit or cash-flow slowdown rather than selective price substitution.
Monitoring these dynamics is designed to help researchers distinguish between localized consumer budget adjustments (consistent with selective trim divergence) and systemic macroeconomic retrenchment (consistent with synchronized stagnation across all price configurations).
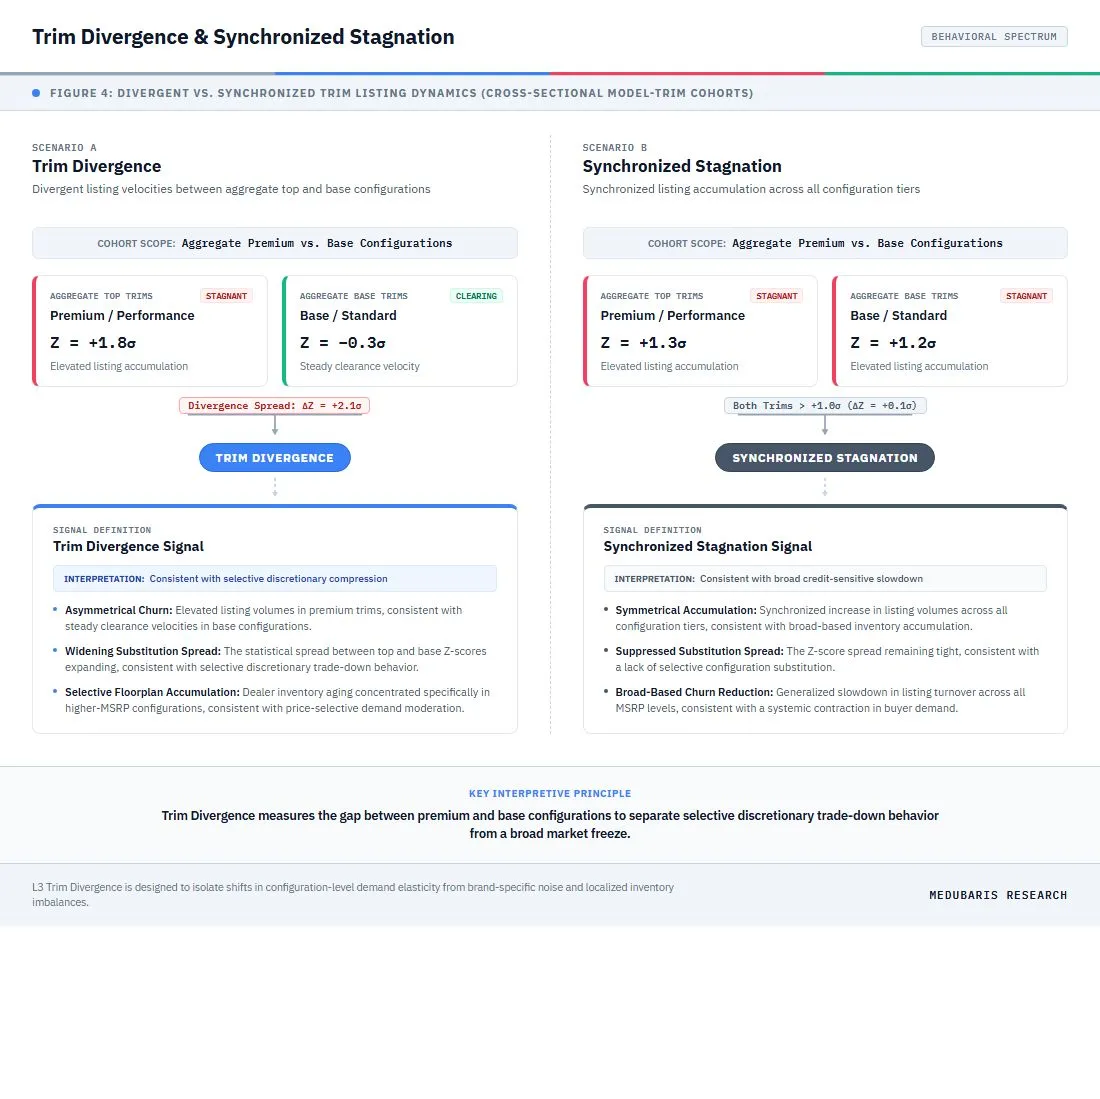
Figure 4. Trim Divergence vs. Synchronized Stagnation Dynamics - Explanatory conceptual diagram showing two distinct market-state scenarios for cross-sectional model-trim cohorts (aggregate top vs. base configurations): (Left) Trim Divergence, consistent with premium configurations accumulating while base configurations clear; (Right) Synchronized Stagnation, consistent with both premium and base configurations accumulating in sync.
Confounders Matrix & Signal Isolation
The Luxury Inventory Sentiment Index (LISI) is valuable not simply because it observes vehicle inventory, but because it operates within a structured, conditional framework designed to separate genuine consumer hesitation from mechanical supply noise.
An institutional approach to alternative data must recognize that visible supply can rise for myriad reasons entirely unrelated to the financial health of the mass-affluent consumer. Therefore, the methodology treats all raw inventory accumulation as inherently ambiguous until contextualized. This section outlines the primary confounders that can artificially distort the observable market surface and details the statistical filters applied to prevent pipeline contamination.
4.13 The Ambiguity of Raw Inventory & The Latency Trade-Off
The raw count of visible listings is only a starting observation. A naive interpretation of alternative data risks equating every localized supply spike with a macroeconomic recession. LISI is engineered on the principle that true consumer hesitation leaves a recognizable, systemic statistical footprint.
To prevent false positives, the framework requires that inventory accumulation exhibit persistence over multiple weeks and spread across multiple geographic metros and vehicle models. The methodology acknowledges an explicit architectural trade-off here: by requiring multi-week persistence and cross-sectional diffusion, LISI sacrifices single-week micro-latency to drastically reduce false-positive rates and ensure signal stability and reduce false-positive observations.
The framework categorizes potential distortions into three major classes: Manufacturer & Supply Chain, Financial & Policy, and Data & Listing.
4.14 Manufacturer & Supply Chain Distortions
These distortions occur when inventory rises simply because upstream supply behavior changed, not because the target demographic pulled back.
- OEM Production Overbuild (The Coherence Filter): A manufacturer may misjudge market capacity and push excess units into the dealer channel. Physical inventory rises dramatically, mimicking a demand collapse.
- Mitigation Logic: LISI utilizes a Cross-Brand Coherence Filter to evaluate regional anomalies. When a Z-score spike is detected in a single MSA (e.g., +2.5$\sigma$ in Los Angeles), the system calculates the correlation of that spike against adjacent premium (Tier-1/Tier-2) models in the same geography. If the spike is isolated to a single OEM (e.g., only Lexus), it is flagged as an ‘Administrative Supply Event’ and its weight in the aggregate index is automatically attenuated until cross-brand diffusion is observed.
- Model-Year Rollover: Inventory may temporarily inflate when outgoing and incoming model years overlap on dealer lots simultaneously.
- Mitigation Logic: The framework evaluates the accumulation against the historical seasonal context of the rolling 52-week anchor, neutralizing the mathematical impact of standard rollover windows.
- Regional Logistics & Port Clearing: A delayed shipment of premium SUVs finally clearing a coastal port can cause a sudden visible spike in a specific region.
- Mitigation Logic: A one-region logistics release will fail the national breadth test, ensuring the system does not classify a localized port clearing as a macro deterioration by default.
4.15 Financial, Incentive & Policy Distortions
Luxury vehicle turnover is heavily tethered to the mechanics of automotive financing and pricing elasticity.
- The “Trunk Money” Blind Spot (Dealer Concessions): OEMs frequently utilize “hidden” incentives—unadvertised dealer cash or “trunk money”—to move oversupplied vehicles.
- Mitigation Logic: Because LISI observes acquired retail prices, it cannot see the true Net Transaction Price. The methodology accepts this limitation by relying purely on physical accumulation. If vehicles move because of hidden discounts, LISI correctly captures a normalization of inventory. However, if physical inventory continues to accumulate despite unobservable pricing interventions, it serves as the ultimate signal of a severe collapse in demand elasticity.
- Captive Finance Strategy Shifts: OEMs and their captive lenders frequently adjust lease economics, including money factor changes or APR subsidy withdrawals.
- Mitigation Logic: If an abrupt inventory build aligns perfectly with a known, structural withdrawal of lease support, the methodology flags the event as a market-structure friction (a pricing test) rather than a pure macroeconomic sentiment contraction.
- Policy & Subsidy Distortions (The EV Exclusion): Certain vehicle categories are heavily distorted by the timing of tax credits and regulatory shifts, making demand policy-driven rather than economically organic.
- Mitigation Logic: This is the primary reason Battery Electric Vehicles (EVs) are explicitly excluded from the current LISI tracked universe. Furthermore, the largest players in the EV space (e.g., Tesla, Rivian) operate Direct-to-Consumer (DTC) models that explicitly withhold localized, observable inventory data. Combining this structural data opacity with extreme policy-driven pricing volatility makes EVs mathematically unsuitable for a clean macroeconomic baseline.
4.16 Data & Listing Distortions
Because LISI aggregates publicly observable online inventory, the visible supply is susceptible to platform-level Schema Drift and digital misrepresentation.
- Schema Drift & Platform Outages: If a major listing surface changes its HTML structure or temporarily blocks acquisition engine IPs, a naive data pipeline will record a sudden “drop” in inventory, falsely signaling extreme market scarcity.
- Mitigation Logic: To address this risk, the pipeline maintains a Data Quality Heartbeat. Every panel cell is assigned a Completeness Score based on the variance and uptime of listing sources. If a primary listing surface experiences a structural drop in volume that is not mirrored across secondary surfaces, the system triggers a Source-Outage Flag. During these periods, the system utilizes a state-hold (forward-fill) protocol rather than mean-imputation, carrying forward the last known valid observation to prevent data gaps from triggering artificial mean-reversion or false clearance signals.
This anomaly rejection capability is illustrated in Figure 5, which shows the empirical telemetry of the raw vs. filtered signals during a collection disruption.
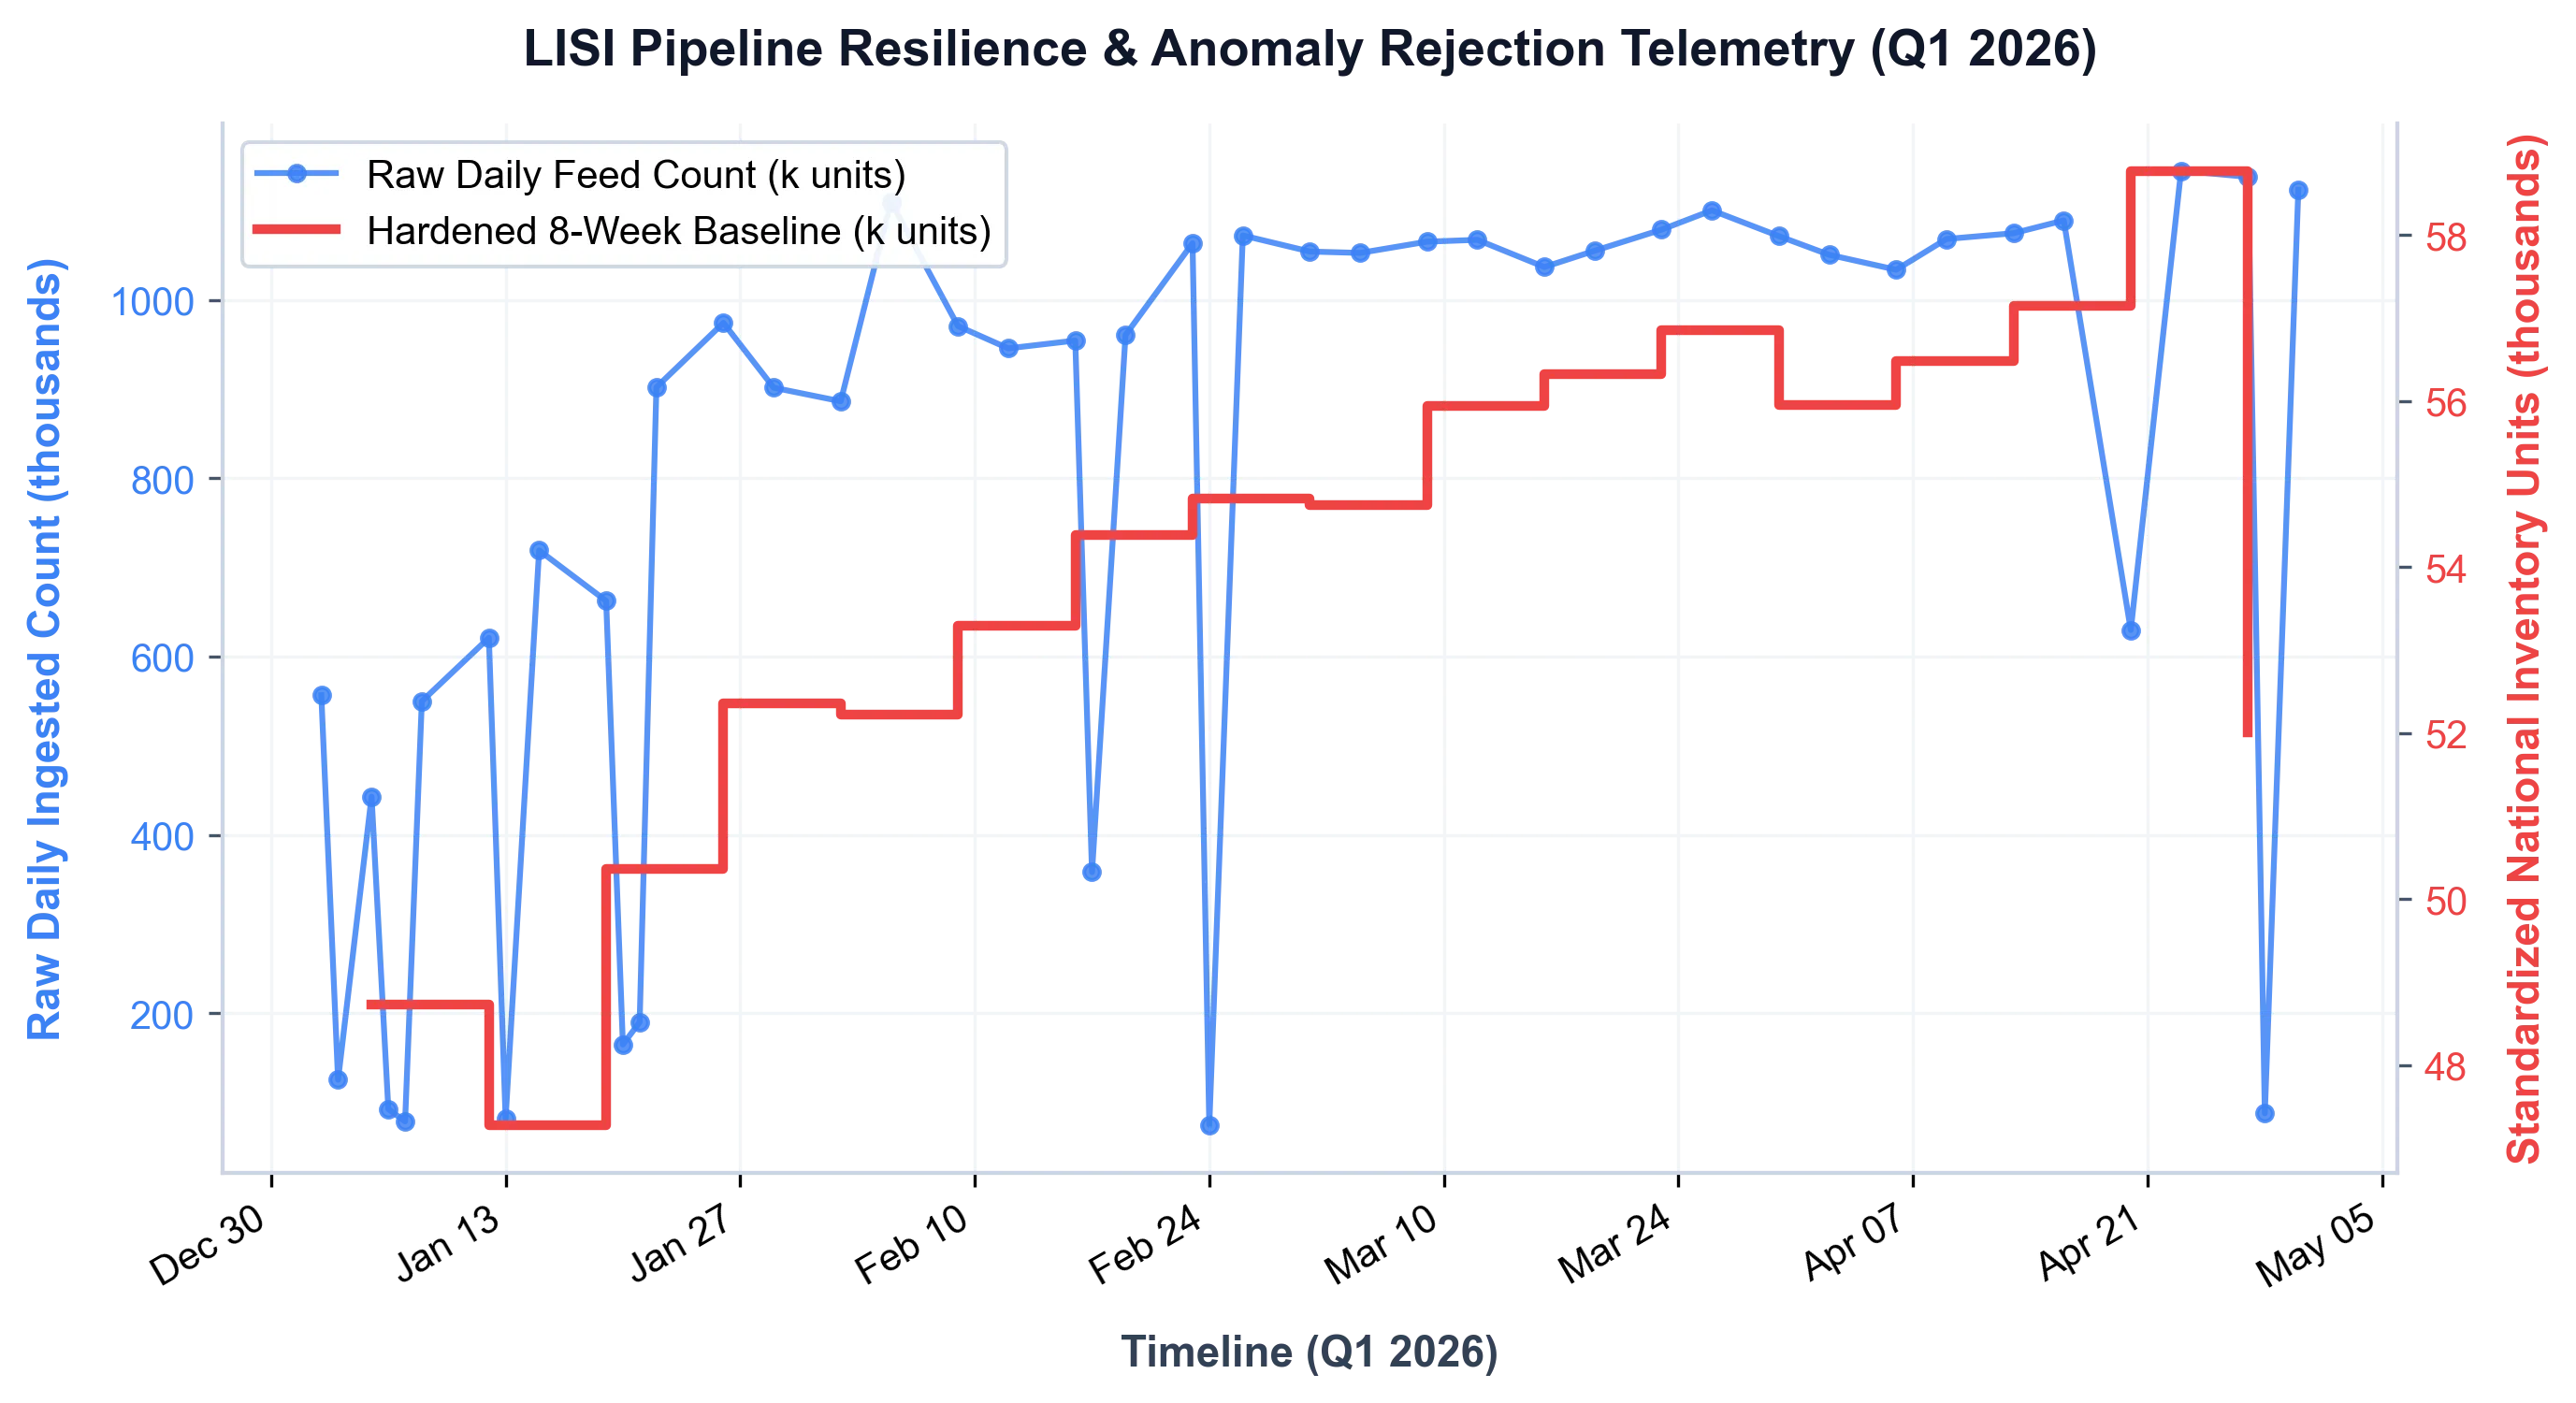
Figure 5: Pipeline Resilience & Anomaly Rejection (Live Q1 2026 Telemetry) — In alternative data, raw digitally acquired feeds (blue series) are inherently vulnerable to collection artifacts—such as API timeouts, weekend reporting desyncs, and acquisition interruptions (visible as sharp, non-economic vertical drops in late February). This telemetry chart proves the resilience of the LISI architecture. By enforcing an 8-week baseline (red series), the pipeline successfully absorbs collection anomalies without triggering false macroeconomic regime shifts, delivering a hardened, production-ready signal for systematic ingestion.
- Duplicate Representation & Listing Inflation: Dealers may occasionally leave sold units visible online to attract leads, or syndicate the same vehicle across multiple platforms, artificially inflating the cell count.
- Mitigation Logic: Rather than relying on fragile manual deduplication, the system uses probabilistic smoothing. By normalizing data into rigid model, trim, and metro buckets and tracking the Z-score variance rather than the nominal total, the system inherently neutralizes the baseline “listing inflation rate” specific to each platform.
Chapter 5: Behavioral Residue Validation
This matrix provides an analytical framework for evaluating whether stated consumer expectations are translating into observable economic behavior. The classification is purely observational: it describes the current alignment state without asserting causal explanations for any divergence.
To support this nowcasting function, the live LISI pipeline operates with an active forward-testing protocol. This protocol serves as a critical technical safeguard and system-control mechanism rather than a retrospective backtesting exercise. Because historical dealer web-listing data is subject to platform schema drift and survivorship bias, recreating historical baselines from web archives is technically unstable. The forward-testing phase functions to monitor real-time Ingestion resilience, validate IP-block defense boundaries, and verify that the pipeline’s statistical normalization triggers correctly under live conditions.
Consequently, the validation framework focuses on confirming signal consistency and cross-metro diffusion rather than historical backfitting. The lead-time relationships described in this section are structurally hypothesized based on the known reporting lags of downstream indicators, and the framework is evaluated by whether localized inventory anomalies systematically precede or co-occur with those lagging series. This section defines the evaluation framework, the criteria for empirical usefulness, and the conditions under which the core thesis would be invalidated.
7.1 What Success Looks Like
Success for the LISI framework is defined as the reliable observation of behavioral state transitions. Any latency advantage relative to traditional economic datasets is a secondary empirical question to be evaluated through out-of-sample testing.
The research utility of LISI is measured by its structural high-frequency observability advantage. Specifically, by providing a non-correlated, high-frequency observation of dealer-level physical friction, the framework is engineered to bypass standard reporting delays, creating an high-frequency observability advantage relative to traditional retrospective indicators like registration data or captive finance credit prints. To model these transitions, the framework utilizes a two-dimensional phase space. Figure 6 maps the conceptual coordinates of these regime states, illustrating how shifts in volume intensity and geographic breadth partition the market, and tracing the typical cyclical path of an inventory accumulation and clearing loop. The empirical, real-time telemetry demonstrating this transition is provided in Appendix C (Figure C.2).
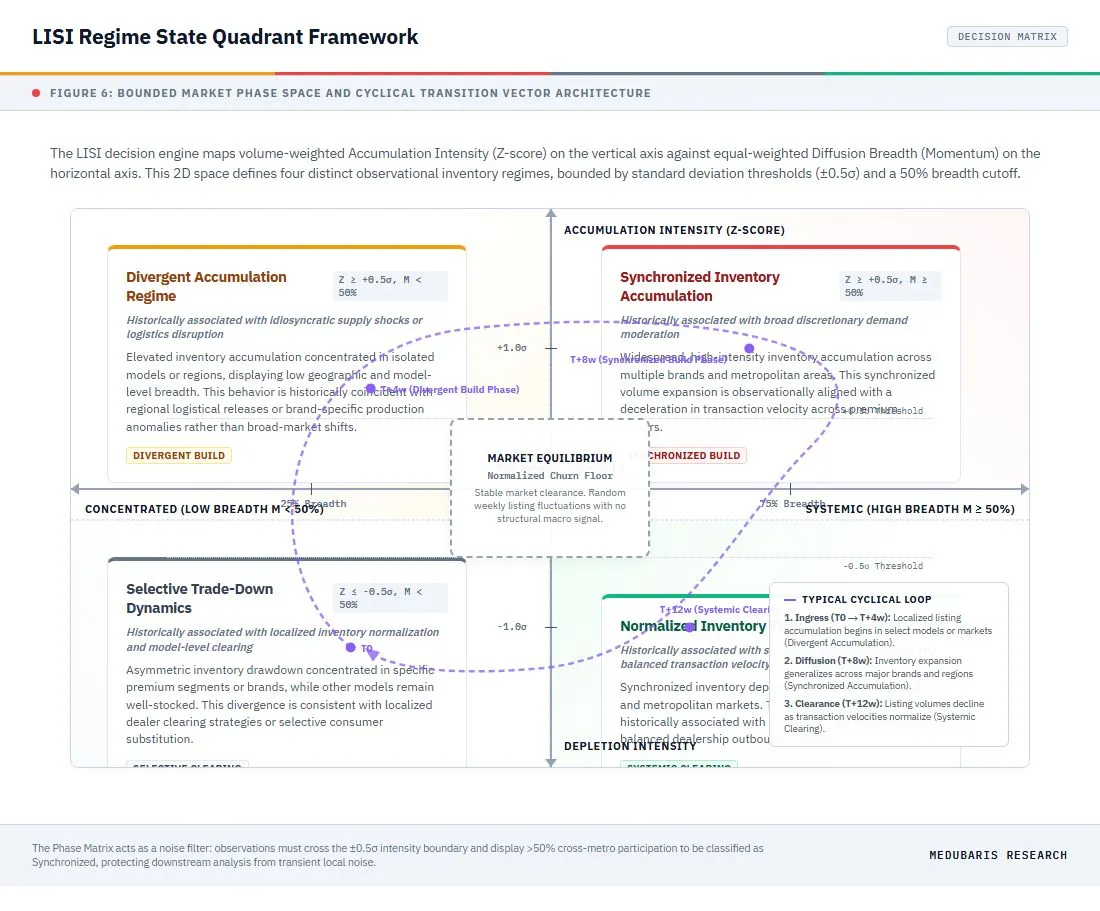
Figure 6: High-Frequency LISI Regime State Quadrant — Conceptual coordinate matrix mapping volume-weighted accumulation intensity (Z-score) against equal-weighted diffusion breadth (Momentum %) to establish bounded macroeconomic regime states. The dotted pathway illustrates the typical chronological lifecycle loop of an inventory accumulation and clearing cycle.
Hypothesized Latency Positioning: Competitive Benchmarking
This matrix illustrates the timeline of a “discretionary hesitation” event—a mass-affluent household deciding to defer a vehicle purchase—and the structural reporting lag before that event surfaces in standard institutional datasets.
| Data Source / Indicator | Measurement Focus | Benchmark / FRED Ticker | Update Frequency | Reporting Lag (Latency) | Analytical Value |
|---|---|---|---|---|---|
| LISI (Our Framework) | Physical accumulation of un-cleared digital inventory. | Proprietary | Weekly Output (Twice-Weekly Measurement) | T + 1 to 2 Days | Hypothesized Early Behavioral Observation Layer. Captures immediate physical residue consistent with consumer hesitation as it happens. |
| Consumer Sentiment Surveys | Household survey measuring subjective spending intentions. | UMCSENT (Univ. of Michigan) [9] | Monthly | T + 14 Days (Prelim) | Soft Leading. Measures what consumers say they will do, not what they actually do with their capital. Subject to heavy survey bias. |
| Industry Estimates (e.g., Cox, Wards) | Highly aggregated sales volume and estimated days-supply. | TOTALSA (Total Vehicle Sales) [10] | Monthly | T + 15 to 30 Days | Coincident. Highly aggregated, heavily estimated, and often smoothed to match OEM PR narratives. |
| Domestic Auto Inventories | Official dollar value and unit count of domestic auto inventories. | AUINVD (BEA via FRED) [11] | Monthly | T + 30 to 45 Days | Lagging. Official government confirmation of inventory build, but delayed by a full reporting cycle. |
| Federal Reserve Consumer Credit (G.19) | Aggregate consumer credit outstanding, specifically auto loans. | MVLOAS (Motor Vehicle Loans) [12] | Monthly | T + 35 to 40 Days | Lagging. Only shows that credit growth has slowed, long after the physical cars have piled up on the lot. |
| Registration Data (Experian, Polk, S&P Global Mobility) | Physical titled registration of the sold vehicle at state DMVs. | State DMVs / S&P Global /Polk [13] | Monthly / Quarterly | T + 60 to 90 Days | Deep Lagging. The gold standard for accuracy, but completely useless for macro nowcasting due to severe processing delays. |
Table 1. Structural Latency
The hypothesized behavioral-to-macro transmission pathway — illustrating how initial inventory accumulation may progress through OEM incentive responses, credit deceleration, and eventually administrative confirmation — is detailed below (Figure 10).
For the LISI framework, success requires that elevated inventory stress conditions demonstrate:
- Persistence: Inventory stress remains elevated or steadily worsens over subsequent weeks, confirming the initial trigger was not a localized data artifact.
- Breadth Expansion: The stress diffuses, spreading from isolated geographic pockets or single vehicle models into a wider portion of the tracked basket.
- Cross-Domain Coherence: Elevated LISI conditions co-occur with or precede measurable weakness in related downstream indicators within a bounded 3- to 6-month window.
- Regime Sensitivity: The framework behaves differently—and accurately—in tight markets versus loose markets, generating coherent structural states rather than uniform statistical noise.
5.1 Internal Validation
Before the signal can be linked to the broader economy, it must be evaluated strictly inside its own observed market. Because LISI is built from aggregated panel constructions (metro × model × trim × week) rather than individual VIN-level event studies, internal validation targets panel behavior, persistence, and directional movement.
Forward Inventory Persistence
When a specific metro-model cohort triggers an elevated stress signal (e.g., $Z > +1.5$), the primary internal test is whether visible inventory remains elevated over the subsequent 4-, 8-, and 12-week forward intervals. A genuine consumer hesitation signal persists. An immediate reversion to the mean suggests either a resolved logistics bottleneck or unobservable, margin-crushing price capitulation (e.g., a dealer deploying unadvertised “trunk money” to clear excess metal). Neither of those fast-reverting scenarios represents a persistent macroeconomic regime shift.
Breadth Confirmation
When a localized stress signal emerges, validation requires observing its transmission. Does the accumulation remain isolated to one market, or does it spread? Expanding breadth separates local mechanical noise from true macro-relevant regime formation. To prevent missing data from creating survivorship bias or false negatives in this breadth measurement, the Diffusion Index dynamically adjusts its denominator to account for localized source outages.
Regime Stability & Threshold Utility
Internal validation requires that regime classifications remain mathematically stable over time, avoiding erratic oscillation. Furthermore, the chosen standard deviation thresholds must demonstrate a statistically significant divergence in forward outcomes, verifying that they separate discrete market states rather than serving as arbitrary aesthetic boundaries.
5.2 External Validation (Cross-Domain Benchmarking)
A serious institutional research framework must define not only how it is constructed, but how it can be falsified. The analytical utility of the Luxury Inventory Sentiment Index (LISI) is maximized when observed inventory friction aligns with deterioration in adjacent domains tied to the mass-affluent household. Validation against these external benchmarks focuses on conditional, out-of-sample relationships, typically observed within a 3- to 6-month forward window.
For the hypothesized cross-domain relationships and their associated falsification criteria, see Section 9 (Research Hypotheses Under Evaluation). The specific cross-domain benchmarks, lead-lag hypotheses, and falsification conditions previously detailed in this section have been elevated to dedicated research hypotheses in Section 9, where they receive the independent analytical treatment appropriate to their current validation status.
5.3 Interpretation Discipline & False Positive Control
To maintain structural integrity and control for false positives, the LISI framework requires strict interpretation discipline. Not every localized rise in visible inventory is consistent with macroeconomic hesitation. To isolate genuine demand deterioration from industry-specific noise, the methodology utilizes a Supply-Push Filter. If an inventory accumulation (+Z) correlates with a known surge in OEM national advertising spend or explicit “Model-Year Clearance” incentives, the engine classifies the observation as a Supply-Injection Event. These events carry a significantly lower macroeconomic weighting than inventory builds that materialize under static incentive conditions.
5.4 The Observer Stance & Automated Commentary
The LISI Narrative Engine (Layer 4) strictly enforces an “Observer Stance” to prevent epistemological overreach. Automated commentary must describe only observable physical inventory states and is explicitly forbidden from making causal claims about buyer psychology or demand drivers. Earlier iterations that utilized definitive causal terminology—such as “demand freezing”—have been deprecated, as a Z-score threshold is a statistical observation of supply, not a confirmation of external economic realities. All narrative generation is mathematically anchored directly to the absolute Headline Index to ensure strict logical alignment, utilizing objective classifications such as “Divergent Clearing” or “Supply Accumulation.” Furthermore, sensor of observable behavioral state transitions outputs require a minimum sample size ($N \ge 15$) to generate continuation probabilities; otherwise, the validation framework defaults to a protective “Shadow Mode.” Additionally, if the aggregate Data Quality Score (representing active sensor weight) drops below the 0.60 threshold due to web-source outages, the system triggers a “DEGRADED_DATA” state. This automatically suppresses indicator confidence and halts narrative generation to prevent capital allocators from acting on fractured data streams.
5.5 Signal Invalidation Conditions
An intellectually honest methodology must explicitly define the conditions under which it fails. Key invalidation conditions include:
- Current Powertrain Distortion (The EV Reality): Battery Electric Vehicles (EVs) already constitute a structurally significant and rapidly growing share of the mass-affluent demographic in key coastal markets like San Francisco, Los Angeles, and Seattle [2, 3, 4, 5]. Because major EV manufacturers operate direct-to-consumer models that withhold localized inventory data, this adoption trend structurally narrows the observable market surface in these metros. If EV penetration accelerates similarly in middle-market MSAs, the ICE and hybrid tracking basket will gradually lose national demographic representativeness. The EV exclusion rationale and re-entry threshold are detailed in Section 6.3 and Appendix A.3.
- Cultural & Status Decoupling: If the premium vehicle permanently loses its societal value as a visible discretionary signal—becoming decoupled from status, convenience, or perceived financial confidence—the asset will cease to function as an accurate proxy for mass-affluent sentiment.
- Structural Ownership Shifts: If the target demographic materially shifts away from personal vehicle ownership due to mass transit substitution, autonomous fleets, or structural urban redesign, localized dealer inventory will stop reflecting cyclical household behavior.
- Financing Regime Transformation: If the fundamental economics of automotive leasing or dealership franchise structures change completely, breaking historical comparability, the standardized measurement of consumer hesitation will degrade.
Part III — Applications
Chapter 6: Potential Macroeconomic Uses
Methodological Context & Joint-Indicator Integration: LISI’s primary analytical utility is distinguishing whether changes in survey-reported sentiment are translating into observable purchasing behavior among the mass-affluent demographic. Its analytical value lies in its ability to be used in conjunction with traditional macroeconomic indicators to verify consumer directionality and distinguish “soft” sentiment shifts from actual physical behavior. For example, while subjective surveys like the University of Michigan Consumer Sentiment Index [9] may decline sharply due to general economic anxiety, LISI serves as a physical check: if premium inventory clearance remains steady, it reveals that the target demographic’s actual purchase behavior has decoupled from their verbal complaints.
Survey-Behavior Confirmation Matrix:
To systematize this validation function, the framework introduces a Survey-Behavior Confirmation Matrix. By cross-referencing the directional signals from traditional survey instruments against LISI’s physical inventory observations, researchers can classify the current macro-behavioral state into one of four distinct regimes:
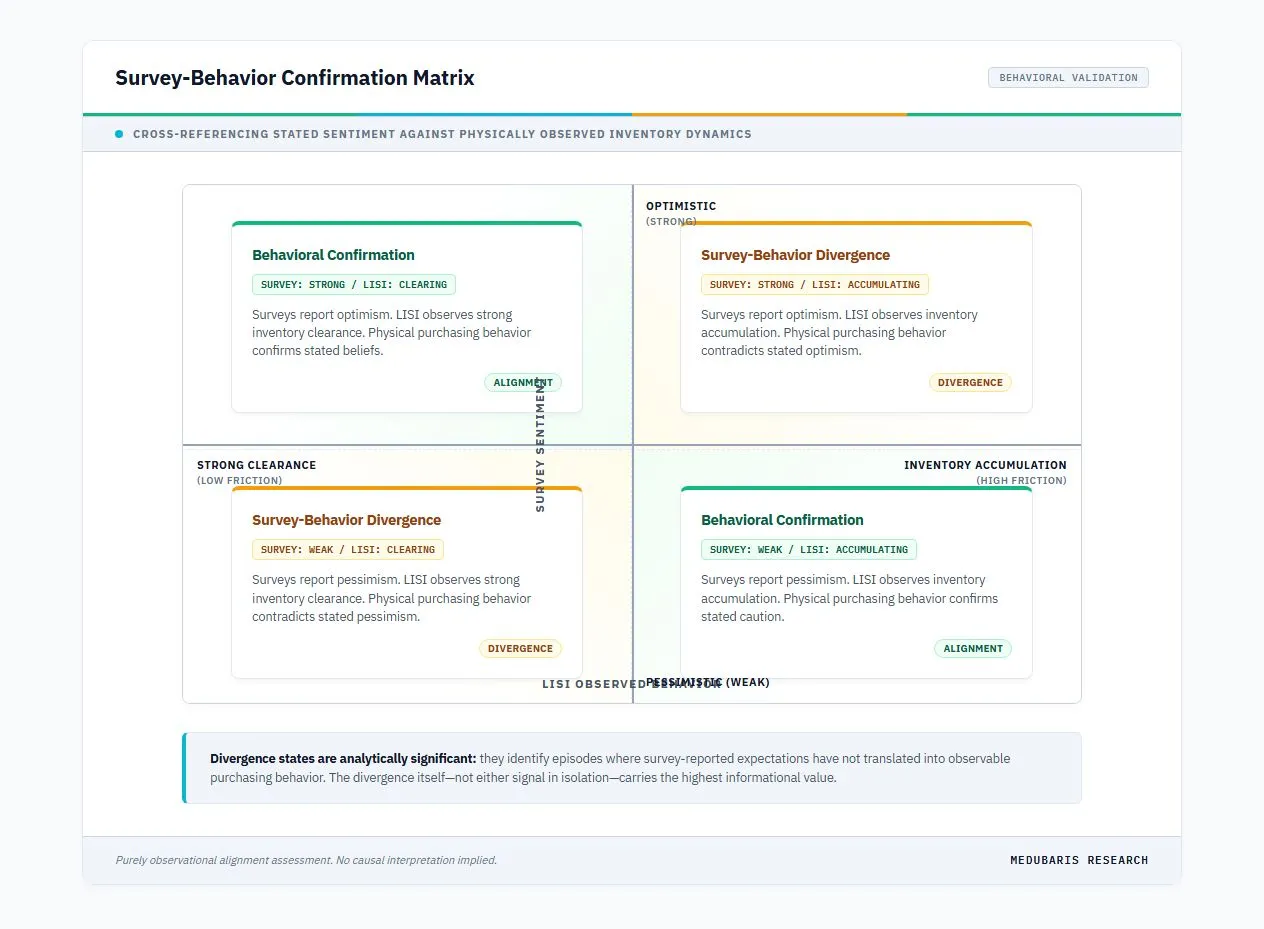
Figure 7: Survey-Behavior Confirmation Matrix - Cross-referencing survey-reported sentiment against physically observed inventory dynamics. Divergence states identify episodes where stated expectations have not translated into observable purchasing behavior.
LISI is engineered as a specialized, high-frequency observational framework for mass-affluent discretionary durable-goods behavior. For macro researchers, institutional analysts, and systematic portfolio managers, LISI’s utility emerges when it is embedded into a broader analytical framework—not as a standalone predictor, but as a distinct layer of physical, real-world behavioral evidence that complements traditional research stacks (outlined in Figure 8).
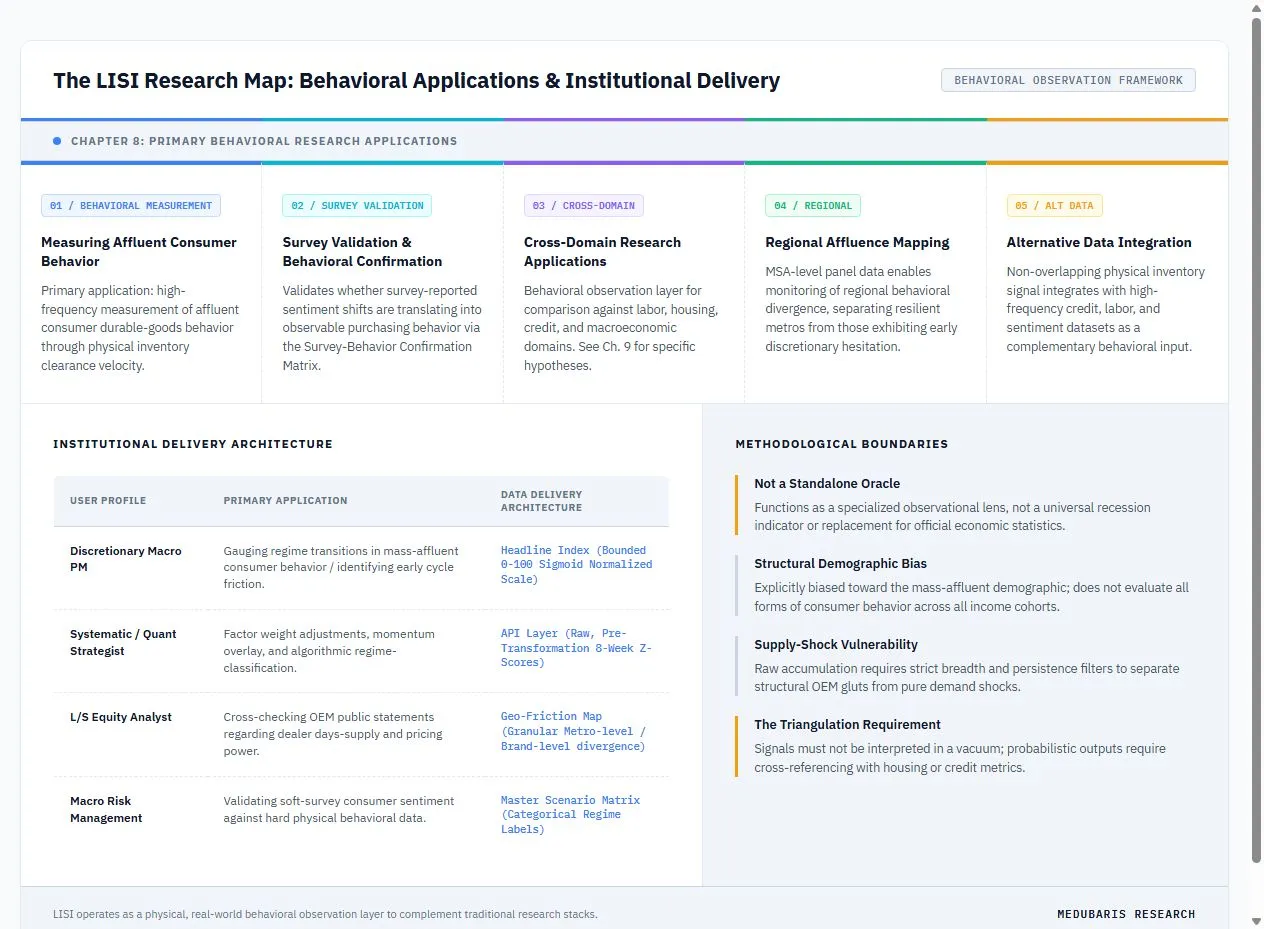
Figure 8. Research Applications Map
Institutional Delivery Architecture
To serve different buy-side and research mandates, the LISI framework delivers insights through bifurcated data pipelines tailored to specific user profiles:
| User Profile | Primary Application | Data Delivery Architecture |
|---|---|---|
| Discretionary Macro PM | Gauging regime transitions in mass-affluent consumer demand / identifying early cycle friction. | Headline Index (Bounded 0-100 Sigmoid Normalized Scale) |
| Systematic / Quant Strategist | Factor weight adjustments, momentum overlay tracking, and systematic regime classification. | Cell-Level regularized Z-Scores (Ingestion-stabilized 8-Week deviations optimized for algorithmic scoring panels) |
| L/S Equity Analyst (Consumer/Auto) | Cross-checking OEM public statements regarding dealer days-supply and pricing power. | Geo-Friction Map (Granular Metro-level / Brand-level divergence) |
| Macro Risk Management | Triangulating soft-survey consumer sentiment weakness with hard physical data. | Master Scenario Matrix (Categorical Regime Labels) |
6.1 Measuring Affluent Consumer Behavior
The primary application of the LISI framework is the high-frequency measurement of affluent consumer durable-goods behavior. Traditional macroeconomic series—such as retail sales, GDP prints, and employment data—are inherently backward-looking. They update monthly or quarterly, are frequently subject to substantial revision lag, and typically confirm that economic conditions have shifted only after the transition is fully underway.
LISI offers a high-frequency observational layer into one highly specific behavioral shift: the rate at which mass-affluent households are deferring or abandoning financed, premium durable commitments. While LISI cannot pinpoint the exact moment a household decides to tighten its budget, it captures immediate physical residue consistent with that hesitation—inventory accumulation. By observing this accumulation as it occurs, researchers can monitor marginal changes in discretionary clearance velocity in near real time and evaluate whether those observations later correspond with downstream credit or retail reports. Ultimately, LISI does not directly forecast GDP or predict recessions; rather, it provides a distinct layer of physical evidence that complements other high-frequency datasets (such as credit card panels), providing an input for macro interpretation before regional softening appears in official lagging reports.
6.2 Survey Validation & Behavioral Confirmation
A distinctive analytical contribution of the LISI framework is its capacity to validate whether survey-reported sentiment shifts are translating into observable purchasing behavior. Traditional sentiment surveys—such as the University of Michigan Consumer Sentiment Index or the Conference Board Consumer Confidence Index—measure stated beliefs and forward expectations. LISI measures physical residue consistent with actual purchasing decisions. When these two signal classes diverge, the divergence itself carries significant analytical information (see Figure 7, Section 6).
When LISI identifies persistent, broad-based hesitation to finance $60k+ durable assets, it provides physical evidence to cross-check earnings narratives within the automotive retail, OEM distribution, and captive finance ecosystems. Rather than attempting to serve as an unweighted index for general consumer retail spending, LISI delivers a high-frequency input for evaluating debt-tolerance shifts within the auto-loan asset class heading into corporate reporting cycles.
6.3 Cross-Domain Research Applications
LISI is not designed to measure labor markets, housing markets, credit conditions, or macroeconomic activity directly. Rather, LISI provides a behavioral observation layer that analysts may compare against these domains when evaluating broader economic conditions. The specific hypothesized relationships between LISI signals and external economic domains are detailed in Section 9 (Research Hypotheses Under Evaluation). This section describes the analyst-driven applications that emerge from such cross-domain comparisons.
6.4 Regional Affluence Mapping
A primary analytical utility of the LISI framework is not necessarily its national aggregate, but its capacity to observe regional divergence. National averages routinely obscure localized economic stress. Household behavior can deteriorate sharply in one metropolitan area while remaining exceptionally resilient in another.
Because LISI aggregates panel data at the Metropolitan Statistical Area (MSA) level, it enables the monitoring of localized supply-demand mismatches. Provided that the signal is adjusted for known OEM regional distribution anomalies, tracking localized LISI diffusion offers a high-frequency method for mapping the geographic contours of a K-shaped consumer economy. This permits the comparison of discretionary accumulation across Metro extremes—for example, contrasting coastal, tech-heavy knowledge economies against energy-linked Sunbelt metros or finance-heavy hubs—separating resilient white-collar labor markets from those experiencing early cyclical drag (exemplified by the cross-metro diffusion heatmap in Figure 9).
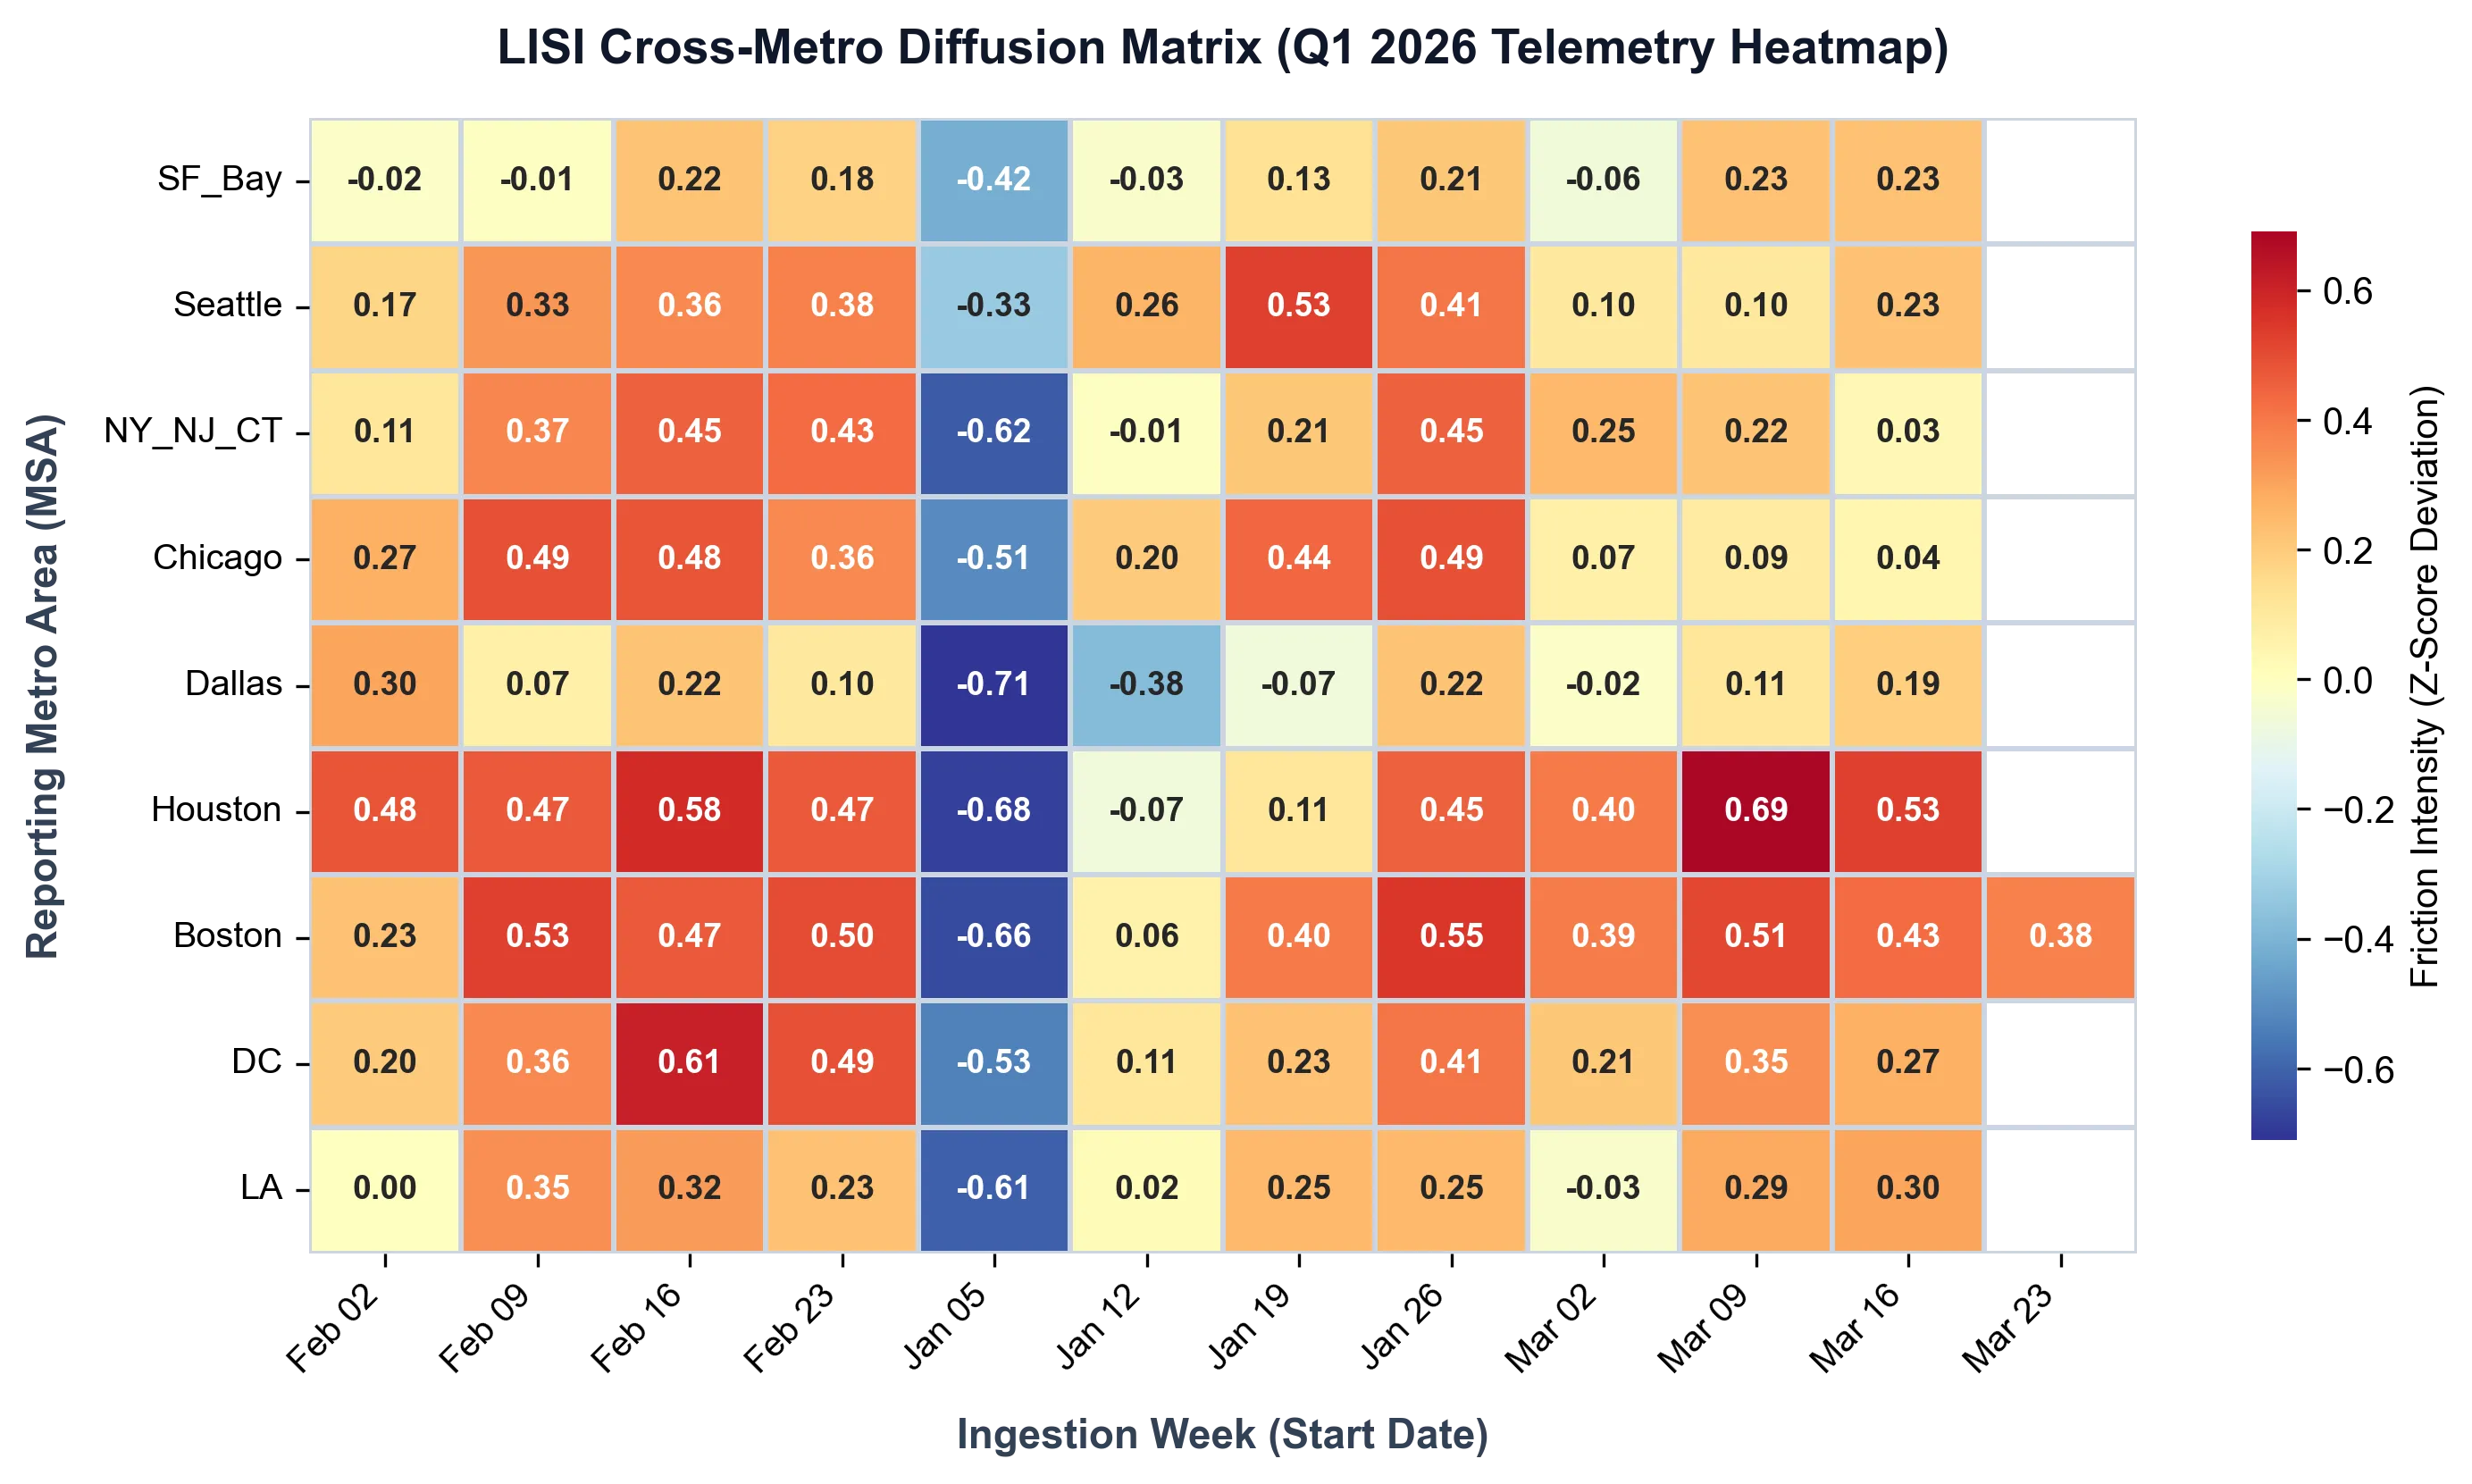
Figure 9: LISI Cross-Metro Diffusion Matrix (Q1 2026 Longitudinal Heatmap) ——T—h—i—s— —t—e—m—p—o—r—a—l— —m—a—t—r—i—x— —t—r—a—c—k—s— —t—h—e— —w—e—e—k—-—o—v—e—r—-—w—e—e—k— —p—e—r—s—i—s—t—e—n—c—e— —o—f— —l—o—c—a—l—i—z—e—d— —i—n—v—e—n—t—o—r—y— —f—r—i—c—t—i—o—n—.— —T—h—e— —d—a—t—a— —i—l—l—u—s—t—r—a—t—e—s— —p—e—r—s—i—s—t—e—n—t— —r—e—g—i—o—n—a—l— —d—i—v—e—r—g—e—n—c—e—w—i—t—h— —s—u—s—t—a—i—n—e—d— —a—c—c—u—m—u—l—a—t—i—o—n— —i—n— —t—e—c—h—-—h—e—a—v—y— —c—o—a—s—t—a—l— —h—u—b—s— —(—e—.—g—.—,— —S—F——B—a—y—)— —a—n—d— —s—t—r—u—c—t—u—r—a—l— —s—c—a—r—c—i—t—y— —i—n— —t—r—a—d—i—t—i—o—n—a—l— —i—n—d—u—s—t—r—i—a—l— —c—e—n—t—e—r—s— —(—e—.—g—.—,— —C—h—i—c—a—g—o—,— —N—Y——N—J—_—C—T—)—r—e—q—u—i—r—i—n—g— —f—u—r—t—h—e—r— —i—n—v—e—s—t—i—g—a—t—i—o—n— —t—o— —d—e—t—e—r—m—i—n—e— —i—f— —t—h—e—s—e— —l—o—c—a—l—i—z—e—d— —o—b—s—e—r—v—a—t—i—o—n—s— —r—e—l—i—a—b—l—y— —p—r—e—c—e—d—e— —m—a—c—r—o—e—c—o—n—o—m—i—c— —s—h—i—f—t—s—.——
6.5 Alternative Data Integration
The signal contributes a unique type of evidence: it is not an opinion survey, it is not a lagged earnings report, and it is not an opaque financial derivative. It is a measurement of physical, real-world clearing behavior. This makes it a highly effective confluence factor when evaluated alongside other high-frequency datasets. Specifically, LISI is designed to be cross-checked with weekly indicators that track real-time labor demand and employment changes:
| Frequency | Indicator | Why (Analytical Mandate) |
|---|---|---|
| Weekly | Initial Jobless Claims | Fastest recession signal in administrative data. |
| Weekly | Indeed Postings Index | Real-time demand for workers. |
Additionally, LISI provides a physical check on subjective sentiment data. Rather than comparing the index to lagging monthly sentiment prints, LISI is best cross-examined against the NY Fed Survey of Consumer Expectations, which serves as the closest equivalent to a traditional consumer sentiment report but focuses on forward household spending and credit expectations. Verifying whether expectations of credit tightness or reduced spending in the NY Fed survey correlate with physical LISI Z-score builds enables analysts to confirm whether psychological anxiety is translating into physical duration-liability aversion. By injecting a high-frequency, physical supply metric into the workflow, LISI provides institutional analysts a physical, supply-chain-based input to confirm, challenge, or localize a broader macroeconomic narrative before it is crystallized in backward-looking administrative data.
6.6 Methodological Boundaries
A rigorous methodology must explicitly define its operational limits. LISI is designed as a specialized proxy for volume friction within a specific demographic subset. To maintain strict institutional credibility, the framework’s boundaries are defined as follows:
- Not a Standalone Oracle: LISI is not a standalone macroeconomic oracle, a universal recession indicator, or a direct sensor of granular consumer intent. It does not function as a standalone investment decision tool or a replacement for official economic statistics.
- Structural Demographic Bias: The framework does not evaluate all forms of consumer behavior or represent all income cohorts equally; it is explicitly and structurally biased toward the mass-affluent demographic.
- Supply-Shock Vulnerability: In isolated episodes, raw inventory accumulation cannot perfectly separate a structural OEM supply glut from a pure demand shock, necessitating the strict application of the breadth and persistence filters detailed in earlier sections.
- The Triangulation Requirement: To achieve high-conviction macro significance, LISI signals must not be interpreted in a vacuum; they must be triangulated with secondary regional housing velocity or high-frequency credit metrics. Ultimately, LISI is best understood not as a broad economic truth machine, but as a specialized observational lens into one high-value behavioral corner of the U.S. economy. By adhering to these strict parameters, the framework delivers disciplined, testable insights that enhance—rather than attempt to replace—sophisticated institutional research stacks.
While LISI serves as a leading behavioral proxy, it cannot definitively confirm the root cause of all inventory movements. For instance, while the engine identifies statistical deviations (e.g., concentrated inventory accumulation), it cannot mathematically prove whether the underlying cause is an isolated OEM volume dump or a broader systemic consumer freeze. Therefore, all outputs must be treated as probabilistic observations of physical supply rather than definitive explanations of consumer intent.
Applications Under Investigation
The preceding chapters establish LISI as a validated observational framework for measuring affluent discretionary durable-goods behavior. The analytical boundaries defined in Section 2 explicitly distinguish between what the framework directly measures and the broader economic domains against which researchers may compare its signals.
This chapter formalizes the cross-domain relationships that are currently under investigation. Each hypothesis is stated in testable form, with identified benchmarks, proposed validation methodologies, and explicit falsification criteria. These hypotheses represent active research questions—not established empirical findings. Researchers should evaluate them with the same statistical rigor applied to any novel alternative data claim.
To illustrate the hypothesized transmission pathway that motivates these research questions, Figure 10 maps the sequential progression from an initial discretionary purchase willingness shift through the credit and administrative reporting pipeline.
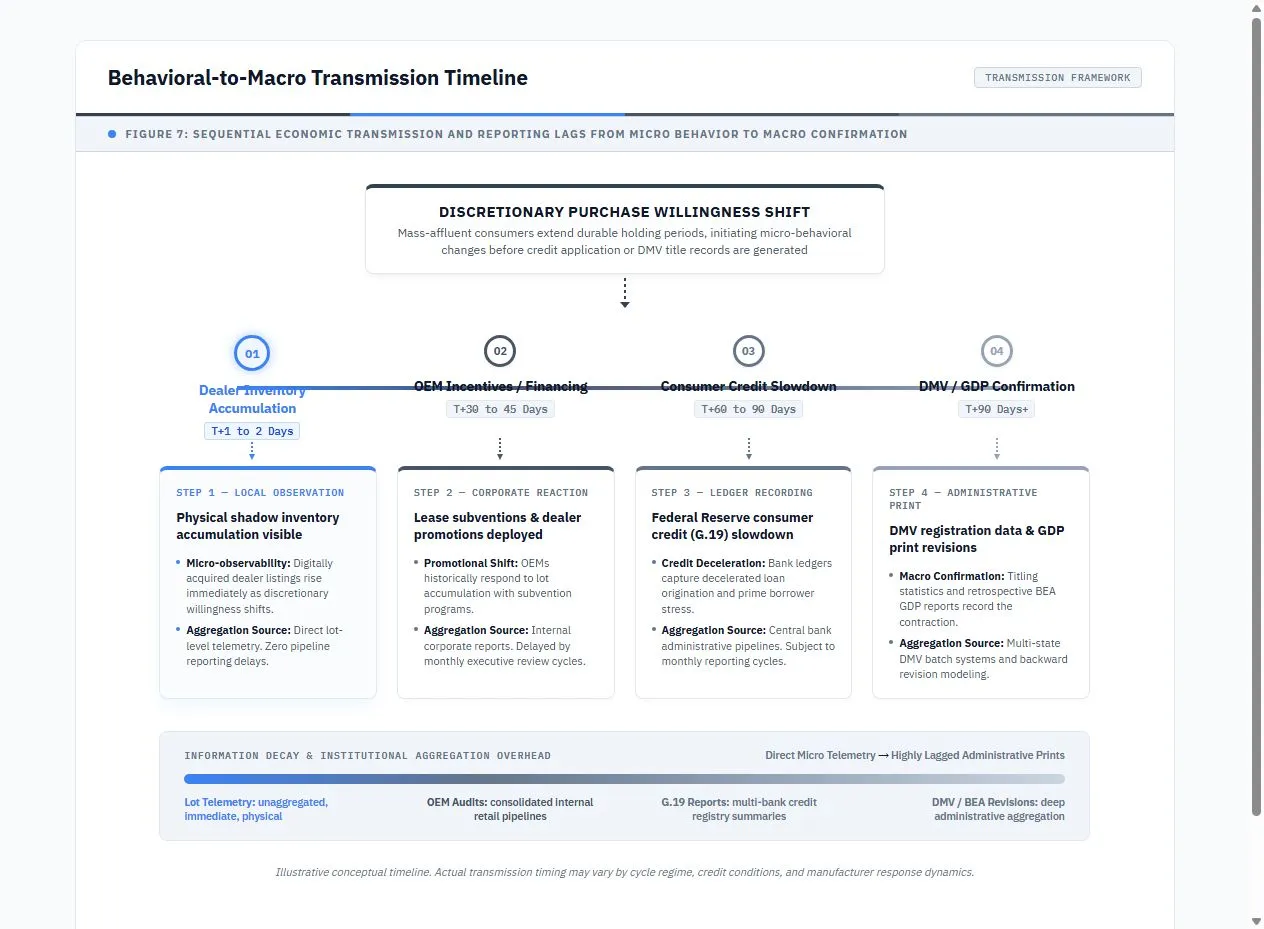
Figure 10. Behavioral-to-Macro Transmission Timeline — Schematic diagram illustrating the sequential progression and reporting lags from an initial discretionary purchase willingness shift to official macroeconomic confirmation.
6.7 Research Application A — Labor Market
Application: Persistent deterioration in affluent durable-goods behavior may precede changes in labor-market conditions.
Rationale: The mass-affluent demographic is heavily concentrated in high-productivity professional sectors where compensation structures include variable bonuses, equity-linked income, and performance-contingent employment. If this cohort begins deferring high-value discretionary purchases, it may reflect early-stage employment uncertainty or compensation compression that has not yet manifested in aggregate labor statistics.
Potential Benchmarks:
- Initial Jobless Claims (DOL)
- Continuing Claims (DOL)
- Indeed Job Postings Index
- ADP National Employment Report
Validation Approach: Researchers may investigate whether persistent changes in affluent durable-goods behavior exhibit statistically significant lead-lag relationships with labor-market indicators. Validation requires out-of-sample testing across multiple economic cycles and explicit controls for confounding supply-side variables.
Falsification Condition: If LISI signals a sustained nationwide inventory accumulation (Glut Expanding regime for 8+ weeks) but Initial Jobless Claims remain stable or declining for a full subsequent quarter, the hypothesized labor-market relationship would not be supported for that episode.
6.8 Research Application B — Housing Market
Application: Persistent deterioration in affluent durable-goods behavior may precede housing-market softening in the same metropolitan areas.
Rationale: The target demographic is simultaneously active in premium automotive and residential real estate markets. Both asset classes involve multi-year financing commitments and are sensitive to interest rate conditions. A household deferring a $60,000+ vehicle liability may also be reassessing a $500,000+ housing commitment.
Potential Benchmarks:
- Days on Market (DOM) — Regional MLS Data
- Pending Home Sales Index (NAR)
- Mortgage Applications (MBA)
- Price Reductions as Percentage of Active Listings
Validation Approach: Researchers may evaluate whether metro-level LISI inventory accumulation precedes corresponding changes in regional housing velocity within a 3- to 6-month forward window. Geographic granularity is essential: a LISI signal in San Francisco should be compared against San Francisco housing data, not national aggregates.
Falsification Condition: If LISI shows persistent inventory accumulation in major coastal metros but housing velocity (Days on Market, Pending Sales) remains at or near cyclical highs in those same metros for a full subsequent quarter, the hypothesized housing-market relationship would not be supported for that episode.
6.9 Research Application C — Credit Markets
Application: Persistent deterioration in affluent durable-goods behavior may coincide with or precede tightening in prime consumer credit conditions.
Rationale: The tracked vehicle segment is overwhelmingly financed. A deceleration in inventory clearance may reflect tightening credit conditions—either through reduced origination appetite from captive lenders, or through household-level reluctance to assume new credit at prevailing rates.
Potential Benchmarks:
- Auto Loan Origination Volume (Experian, TransUnion)
- Prime Auto Lending Standards (Federal Reserve Senior Loan Officer Survey)
- Consumer Credit Growth (Federal Reserve G.19)
- Captive Finance Subvention Activity
Validation Approach: Analysts may evaluate whether inventory accumulation co-occurs with or precedes tightening in captive finance origination volumes and prime lending standards within a 3- to 6-month window.
Falsification Condition: If LISI shows persistent inventory accumulation while prime auto originations are rising and lending standards are loosening, the accumulation is more consistent with a supply-chain overfill than a credit-driven consumer retreat.
6.10 Research Application D — Macroeconomic Behavioral Sensor
Application: Persistent deterioration in affluent durable-goods behavior may exhibit an observation-latency advantage relative to selected macroeconomic indicators.
Rationale: If affluent discretionary behavior deteriorates systematically before broader macroeconomic aggregates register weakness, LISI may provide an observation-latency advantage over lagging administrative datasets. This application requires the most rigorous validation standard, as claims of an observation-latency advantage carry significant institutional risk if not supported by robust out-of-sample evidence.
Potential Benchmarks:
- GDP (BEA Advance Estimate)
- Durable Goods Orders (Census Bureau)
- Domestic Auto Inventories (AUINVD via FRED)
- Consumer Credit Outstanding (G.19 via FRED)
Validation Requirements:
- Forward out-of-sample validation across at least two distinct economic regimes
- Regime-conditional analysis (behavior may differ in rate-hiking vs. rate-cutting environments)
- Explicit controls for supply-side confounders
- Statistical significance testing with appropriate multiple-comparison corrections
Falsification Condition: If LISI regime transitions show no statistically significant latency advantage over existing high-frequency indicators (e.g., Initial Claims, consumer sentiment surveys) across multiple economic cycles, the latency-advantage hypothesis would not be supported.
6.11 Research Application E — Incremental Information Content
Application: Persistent changes in affluent durable-goods behavior may provide information not fully captured by survey-based measures of consumer sentiment and expectations.
Rationale: Traditional survey instruments measure stated beliefs and subjective expectations. LISI measures physical residue consistent with actual purchasing decisions. If these two signal classes carry non-redundant information—that is, if LISI provides explanatory power beyond what surveys already capture—it establishes the framework’s institutional value as a complementary analytical tool. This hypothesis may represent the most immediately testable claim within the LISI research agenda, as the conceptual distinction between stated preference (surveys) and revealed preference (physical behavior) is well-established in economic theory.
Potential Benchmarks:
- University of Michigan Consumer Sentiment Index (UMCSENT)
- Conference Board Consumer Confidence Index
- Federal Reserve Bank of New York Survey of Consumer Expectations (SCE)
Validation Methods:
- Partial correlation analysis (controlling for survey measures)
- Incremental explanatory power tests (nested F-tests, information criteria comparisons)
- Regression residual analysis (does LISI explain variance in downstream indicators that surveys do not?)
- Out-of-sample comparison (does adding LISI to a survey-based model improve forecast accuracy?)
Falsification Condition: If LISI signals are fully explained by contemporaneous survey movements—that is, if LISI adds no statistically significant incremental explanatory power in nested regression models after controlling for Michigan, Conference Board, and NY Fed SCE—the framework’s value as a complementary behavioral check would not be supported.
6.12 Hypothesized Cross-Domain Relationships
The following matrix summarizes the hypothesized relationships between LISI signals and external economic indicators. These relationships are presented as testable propositions, not established empirical findings. The falsification conditions define the specific observable outcomes that would invalidate each hypothesized relationship.
| External Benchmark | Hypothesized Relationship | Hypothesized Lead/Lag | Falsification Condition |
|---|---|---|---|
| OEM Incentives | LISI Glut may precede increased subvention activity | ~1 Quarter | If LISI shows a 2-month glut but MSRPs/Lease deals remain firm, the accumulation is more consistent with logistics noise than demand weakness. |
| Housing (DOM) | LISI Glut may precede increased Days on Market | 3-6 Months | If LISI spikes in SF/NY but housing velocity remains at record highs, the signal is more consistent with sector-specific auto supply shocks. |
| Prime Credit | LISI Glut may coincide with declining origination | Coincident | If LISI shows a glut while prime originations are rising, the accumulation is more consistent with supply-chain overfill. |
| Indeed Postings Index | Indeed decline may precede or coincide with LISI Glut | Coincident to 1-2 Months | If job postings drop nationally but LISI remains stable, the mass-affluent wallet may have decoupled from employment advertising velocity. |
| Initial Jobless Claims | LISI Glut may precede rising Claims | 1-2 Months | If LISI signals nationwide Glut but Initial Claims remain low for a full quarter, the accumulation is more consistent with supply-chain mismatch. |
| Sentiment (NY Fed SCE) | Expectations decline may coincide with LISI Glut | Coincident | If NY Fed SCE expectations hit historic lows but LISI clearance rates remain high, verbal anxiety has not translated into physical liability aversion. |
Table 2. Hypothesized Cross-Domain Relationships Under Evaluation
Interpretation Discipline: A LISI signal in isolation has watch-list value. If confirmed by secondary deterioration in localized housing or credit metrics within 180 days, it achieves higher research significance. If LISI moves in isolation—with no corresponding housing, credit, or incentive movement—for more than 8 weeks, the signal should be evaluated as a potential supply-side artifact rather than a demand-driven behavioral shift.
Chapter 7: Case Study: Behavioral State Transition
(Note: The following case study is an illustrative, hypothetical framework designed to demonstrate the narrative sequencing and alternative explanation logic of the LISI methodology. It utilizes representative structural dynamics pending full empirical validation.)
Observation
In this scenario, the LISI framework detects a sustained, multi-week expansion in physical inventory across Tier-1 premium utility vehicles in key coastal and sunbelt MSAs. The Aggregate Diffusion Index rises above 60%, and the Z-scores for high-trim configurations hit +1.5 standard deviations.
Interpretation
The framework interprets this signal as a mass-affluent behavioral hesitation. The observable residue—inventory accumulation—suggests that consumers are electing to defer new multi-year duration liabilities, extending existing leases or opting for lower-trim configurations.
Alternative Explanations (The Scientific Buffer)
Before confirming a behavioral transition, alternative hypotheses must be systematically ruled out:
- OEM Production Overbuild: Is a specific manufacturer flooding the market? Cross-brand diffusion data shows the accumulation is occurring simultaneously across competing brands (e.g., BMW, Lexus, Mercedes), neutralizing the isolated overbuild theory.
- Model-Year Rollover: Is this a seasonal clearance issue? The 52-week rolling Z-score anchor naturally accounts for seasonal rollovers, meaning the observed accumulation is structurally abnormal for this specific week of the year.
- Regional Logistics Release: Did a major port just clear a backlog? The accumulation is mapped across Metro extremes (e.g., both Los Angeles and Dallas simultaneously), invalidating localized logistical bottlenecks.
Consequently, while alternative supply-side anomalies remain possible, the synchronized cross-brand accumulation satisfies the conditions for a hypothesized behavioral hesitation state, flagging the panel for ongoing observation. LISI does not definitively rule out all complex supply-chain reallocations, but rather flags the structural anomaly for cross-reference against lagging survey data.
Survey Confirmation
Following the LISI observation of physical inventory expansion, subsequent lagging data from the NY Fed Survey of Consumer Expectations and the University of Michigan index begin to reflect a deterioration in consumer sentiment and an increase in labor-market anxiety among households earning over $100,000.
Macro Outcome
Ultimately, the behavioral hesitation materializes in lagging administrative data, with potential subsequent weakness visible in Retail Sales and Initial Jobless Claims over the following quarter.
10. Appendix
Appendix A — Tracked Universe Specifications
A.1 Governance & Version Control
Current Specification: LISI Universe v2.1
Update Frequency: Annually (September, synchronized with OEM model-year rollover and taxonomy updates).
Universe Objective: Maintain a demographically representative, highly liquid panel of Tier 1 (Premium/Near-Luxury) and Tier 2 (Full Luxury) utility vehicles targeting the mass-affluent HHI demographic.
A.2 Geographic Specifications (Core MSAs)
The physical tracking universe is constrained to Metropolitan Statistical Areas (MSAs) meeting the requisite Mass-Affluent Density Score. The index is weighted across 10 primary markets:
- Coastal / Knowledge Hubs: San Francisco-Oakland-Berkeley (CA), San Jose-Sunnyvale-Santa Clara (CA), Seattle-Tacoma-Bellevue (WA), Washington-Arlington-Alexandria (DC-VA-MD-WV), Boston-Cambridge-Newton (MA), New York-Newark-Jersey City (NY-NJ-PA) [Enforces explicit inclusion of Fairfield County, CT ZCTAs].
- Sunbelt / Industrial Hubs: Dallas-Fort Worth-Arlington (TX), Houston-The Woodlands-Sugar Land (TX), Chicago-Naperville-Elgin (IL), Los Angeles-Long Beach-Anaheim (CA).
A.3 Powertrain & Pricing Parameters
- Target MSRP Band: $45,000 – $75,000 (Indexed annually to absorb baseline OEM pricing inflation).
- Included Powertrains: Internal Combustion Engine (ICE), Mild Hybrid (MHEV), Plug-in Hybrid (PHEV).
- Excluded Powertrains: Battery Electric Vehicles (BEV).
- Exclusion Rationale: Structural data opacity from Direct-to-Consumer (DTC) manufacturers (e.g., Tesla, Rivian) and heavy distortion from federal/state tax subsidies fundamentally decouple BEV clearance rates from organic macroeconomic demand.
A.4 Tier 1 Core Model Basket
The LISI aggregate derives its signal from the following Tier 1 Premium/Near-Luxury platforms. These specific models are selected for their high historical lease penetration, strict demographic alignment, and sufficient national production volume.
-
Lexus: RX, TX
-
BMW: X3
-
Audi: Q5
-
Volvo: XC60
-
Acura: MDX
-
Mercedes-Benz: GLC
-
Genesis: GV70, GV80 (Note: Tier 2 (Full Luxury: e.g., BMW X7, Cadillac Escalade) and Tier 3 (Ultra-Luxury: e.g., Range Rover, Porsche Cayenne) are explicitly excluded from the Core LISI Aggregate Headline Index to prevent wealth-driven inelasticity from dampening the cyclical signal. However, Tier 2 platforms are actively maintained as an independent tracking universe on the backend to calculate the Substitution Spread—see Appendix D.7).
A.5 Trim-Level Qualification Logic
Raw inventory counts for the approved models are subject to strict trim-level filtering to eliminate statistical noise from sub-segments that do not align with the target household.
- Exclusion Rule 1 (Entry-Level Dilution): Base-model trims lacking core premium optionality or utilizing two-wheel-drive configurations in cold-weather MSAs are excluded.
- Exclusion Rule 2 (Fleet Contamination): Trim codes historically associated with corporate or rental fleet allocations are excluded.
- Exclusion Rule 3 (Halo/Performance Distortion): Ultra-high-performance sub-models (e.g., BMW X3 M, Mercedes-AMG GLC 63) are excluded. Pricing for these units structurally exceeds the target MSRP band, and their buyer behavior decouples from standard prime credit sensitivity.
- Divergence Bucket Stratification: To support Trim Divergence Panels, qualified trims are strictly mapped into normalized categorical buckets: TOP_TRIM (Highest MSRP configurations with maximum optionality), MID_TRIM (The core volume lease configurations), and LOW_TRIM (Entry-level premium configurations).
Appendix B — Data Dictionary
B.1 Schema Overview
This dictionary defines the structural outputs of the LISI pipeline. The data architecture is bifurcated into two primary layers: the Granular Research Panel (cell-level data used for systematic quantitative ingestion) and the Macro Aggregate Output (composite metrics used for executive dashboarding and discretionary research).
B.2 Core Panel Identifiers (Cross-Sectional Keys)
These fields establish the fundamental unit of analysis (observation_date × msa_alias × model_id × trim_bucket).
- observation_date (Date): The pipeline run date (weekly frequency, anchored to Sunday 23:59 EST).
- msa_alias (String): Standardized Metropolitan Statistical Area (MSA) identifier.
- brand_id (String): Standardized OEM identifier (e.g., LEXUS, BMW).
- model_id (String): Standardized platform identifier (e.g., RX, X3).
- trim_bucket (String): The normalized qualification tier (e.g., PREMIUM_PLUS).
- powertrain_type (String): Classification of drivetrain (ICE, MHEV, PHEV).
B.3 Quantitative Observation & Stress Metrics (Cell-Level)
- raw_inventory_count (Integer): The absolute count of physically visible, qualifying units within the panel cell at the time of observation.
- historical_mean_52wk (Float): The rolling 52-week historical mean ($\mu$) for the specific panel cell.
- historical_std_dev_52wk (Float): The rolling 52-week standard deviation ($\sigma$), subject to the defined volatility floor.
- cell_z_score (Float): The pre-transformation (unbounded) standard deviation metric: $(X - \mu) / \sigma$. This is the primary API output for systematic quantitative evaluation.
B.4 Macro Aggregate Outputs (Top-Level & Headline)
- aggregate_diffusion_index (Float): Scaled breadth metric (0.0 to 100.0). Represents the percentage of tracked panel cells currently exhibiting a standard deviation of $Z > +1.0$.
- tier1_accumulation_z (Float): The volume-weighted average Z-score strictly for Core Tier 1 models.
- lisi_headline_index (Float): The executive composite heuristic. Utilizes sigmoid normalization logic to map unbounded variance into a constrained 0.0 to 100.0 scale, weighting both Diffusion and Accumulation.
- regime_transition_label (String): Categorical string assigned via the mathematical coordinates of Z-score and Diffusion.
- momentum_vector (String): Directional indicator tracking the week-over-week change in the regime state.
B.5 System Governance & Pipeline Integrity Metrics
- data_quality_score (Float): The “Data Quality Heartbeat” (0.0 to 1.0). Evaluates the uptime, acquisition completion rate, and structural schema consistency of the underlying listing sources.
- source_outage_flag (Boolean): Returns TRUE if data_quality_score drops below 0.60. Triggers the state-hold protocol.
- pipeline_run_timestamp (Timestamp): Exact UTC timestamp of the aggregation run. Ensures strict point-in-time (PIT) logging.
B.6 Signal Construction Schematic
To provide a complete technical reference for implementation, Figure B.2 illustrates the detailed mathematical formulas, threshold values, and specific governance constraints applied at each step of the pipeline.
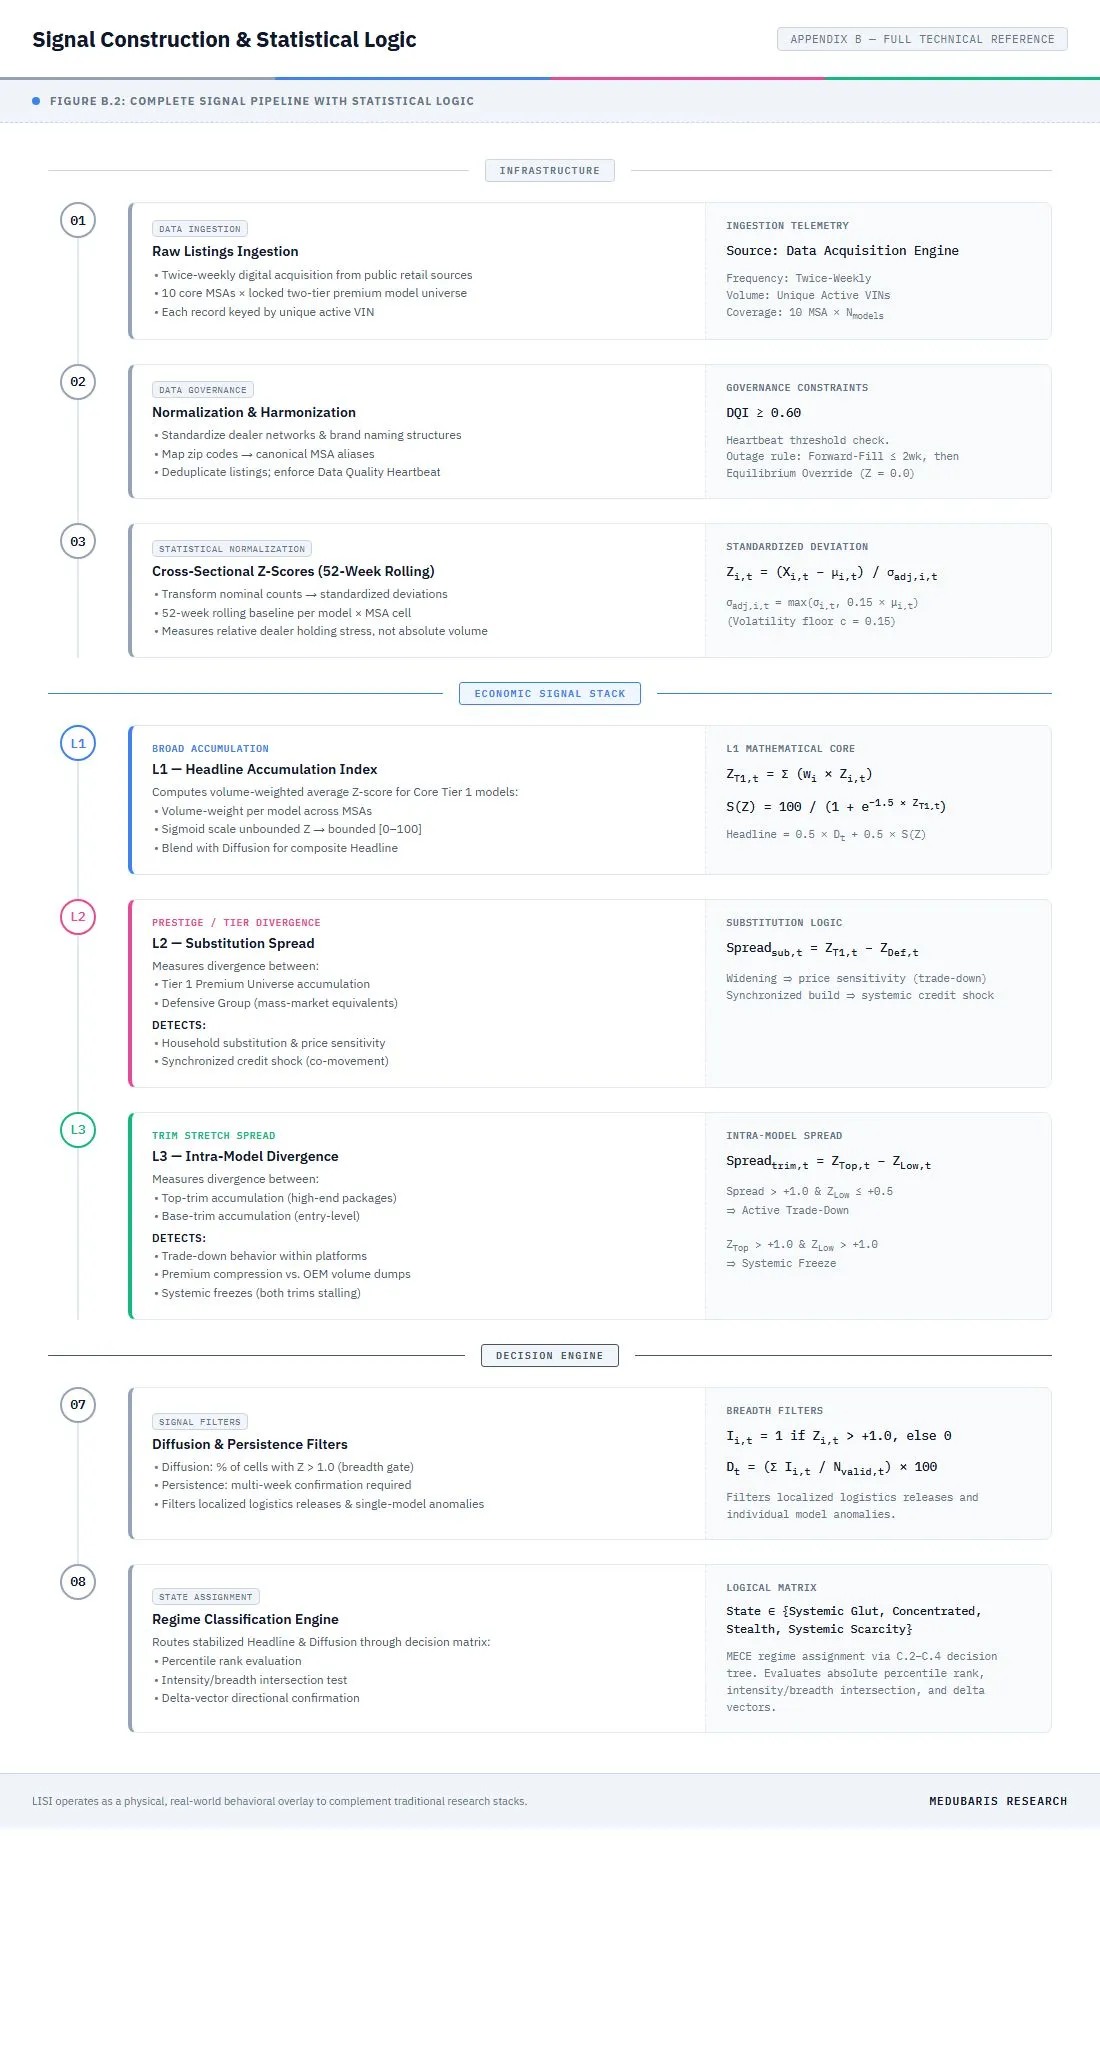
Figure B.2. Complete Signal Construction Pipeline — Detailed technical schema showing specific normalization parameters, substitution and trim divergence formulas, and decision boundaries for final regime classification.
Appendix C — Regime Classification Architecture
C.1 Classification Architecture
LISI utilizes a multi-layered classification framework to assign macroeconomic regime labels. Rather than relying on static, hardcoded thresholds which are vulnerable to idiosyncratic market noise, the engine utilizes a continuous CASE WHEN logical hierarchy. This hierarchy ensures that all mathematical states are Mutually Exclusive and Collectively Exhaustive (MECE), meaning every possible market condition resolves to a definitive regime label without producing orphaned data states.
The classification framework is designed to remain mutually exclusive and collectively exhaustive (MECE) at every execution interval. Each observation is deterministically assigned to exactly one state classification (C.2), one phase classification (C.3), and one transition vector (C.4), preventing overlap ambiguity and ensuring reproducible regime labeling across time.
Transition vectors activate only when both directional intensity and breadth exceed minimum sensitivity thresholds simultaneously. Observations failing to satisfy concurrent activation criteria default to the Stable classification, preserving mutually exclusive and collectively exhaustive (MECE) regime assignment across all execution intervals.
The pipeline evaluates conditions across three distinct dimensions:
- Master Scenarios (The Absolute Temperature): A 5-tier categorization evaluating the total market against a 1-year relative historical baseline.
- The Phase Matrix (The Structural State): A 4-quadrant boolean logic gate combining Core Accumulation (Intensity) and Market Momentum (Breadth).
- Regime Transition Indicators (The Velocity Vectors): Evaluates week-over-week deltas to determine the directional trajectory of the market.
The logical sequence routing these evaluations is mapped out in the decision tree in Figure C.1.
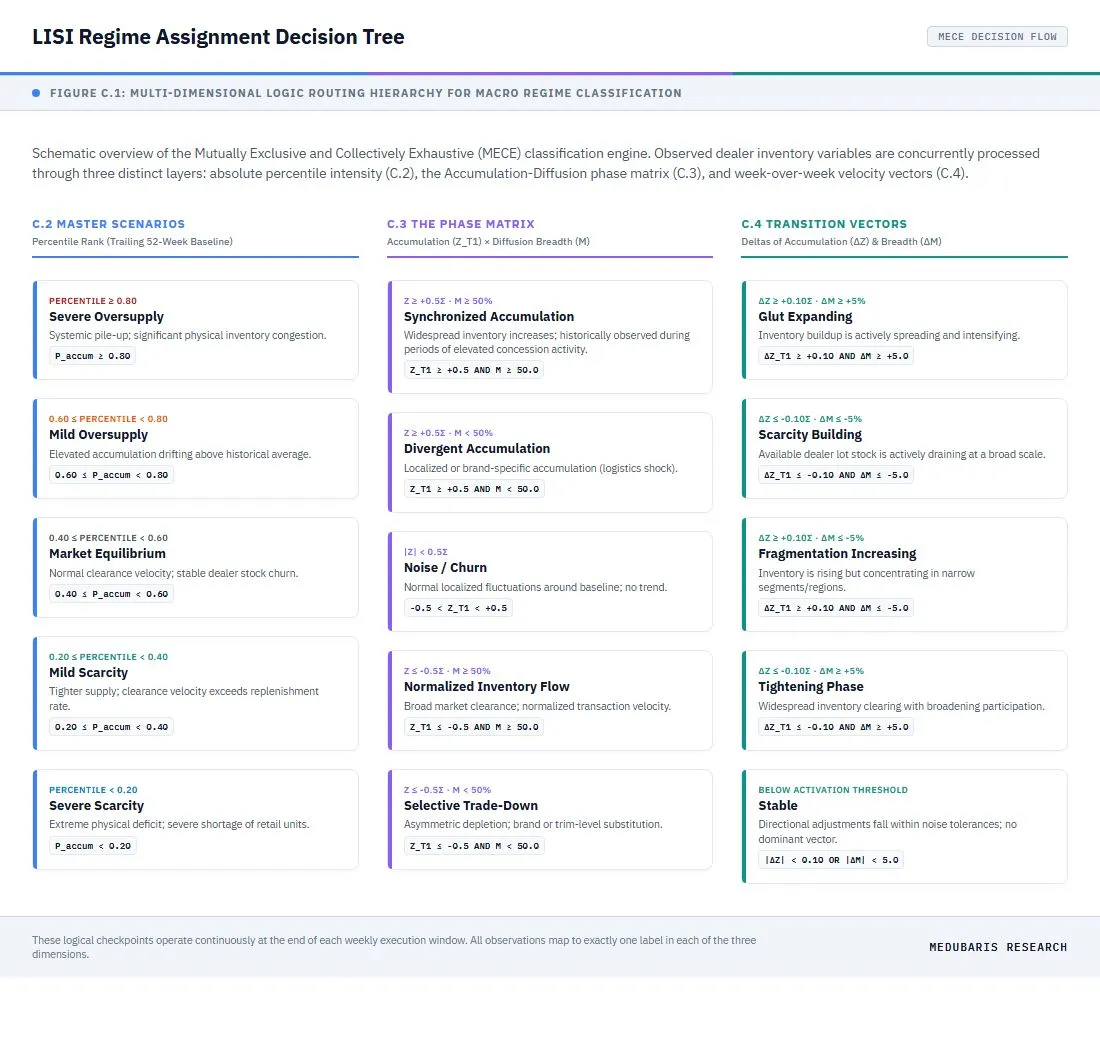
Figure C.1: Regime Assignment Decision Tree — Logic-gate flowchart illustrating the multi-layered MECE classification framework, routing from static percentile-based scenarios (C.2) through the Accumulation-Diffusion phase space matrix (C.3) to the week-over-week velocity vectors of the Regime Transition Indicator (C.4).
C.2 Static State Regimes (Master Scenarios)
To categorize the absolute physical magnitude of the market without creating dead zones, the engine ranks the current week’s Total Accumulation Z-Score against a trailing 52-week baseline. It then assigns a state based on its percentile rank ($P_{accum}$). Because this evaluates linearly, all states are mutually exclusive.
- SEVERE OVERSUPPLY: $P_{accum} \ge 0.80$. The market is in the top 20% of historical inventory accumulation. Systemic pile-up.
- MILD OVERSUPPLY: $0.60 \le P_{accum} < 0.80$. Elevated accumulation moving above historical equilibrium.
- MARKET EQUILIBRIUM: $0.40 \le P_{accum} < 0.60$. Normal clearance velocity. Market conditions are stable; no macro alert.
- MILD SCARCITY: $0.20 \le P_{accum} < 0.40$. Tighter-than-normal supply.
- SEVERE SCARCITY: $P_{accum} < 0.20$. The market is in the bottom 20% of historical inventory. Extreme physical deficit.
Because C.2 evaluates Percentile Rank against a trailing 52-week baseline, these scenarios measure relative market pressure, not absolute nominal inventory counts. A ‘Severe Scarcity’ label in a structurally bloated market simply indicates that the rate of accumulation has reached a localized 12-month low.
C.3 The Phase Matrix (Dual-Lens Classification)
To identify structural alignment or divergence in the market, the engine evaluates the intersection of Volume-Weighted Tier 1 Accumulation ($Z_{T1}$) and Equal-Weighted Momentum/Breadth ($M$). By contrasting a volume-weighted metric against an equal-weighted diffusion metric, the matrix detects structural divergences between high-volume anchors and the broader market surface.
To prevent false positives triggered by standard weekly churn, the matrix employs a $\pm 0.5\sigma$ neutrality buffer, ensuring that absolute accumulation must pass the threshold of economic “floorplan pain” before triggering an extreme state.
Classification Stability & Jitter Mitigation (Hysteresis Buffer): Because retail automotive inventory distributions are right-skewed and susceptible to weekend reporting batch desyncs, a static boundary can cause classification flip-flopping (jitter) when the index hovers near the $\pm 0.5\sigma$ threshold. To mitigate this boundary instability, LISI implements three structural safeguards:
- Multi-Sensor Consensus Blending: Rather than relying on a single web aggregator, LISI blends five independent data sources (OEM feeds, MarketCheck, Cars.com, CarGurus, and Autotrader) with fixed source-weight coefficients. A schema change or batch-reconciliation event by a single data aggregator is attenuated by the other active feeds.
- Diffusion Index Breadth Filter: Because a volume-weighted aggregate like $Z_{T1}$ can be heavily influenced by high-volume MSAs (e.g., Los Angeles and the New York Tri-State area), a localized or single-network listing anomaly could push $Z_{T1}$ past the $0.5\sigma$ threshold. To prevent this from triggering a false systemic regime, the Phase Matrix requires both $Z_{T1} \ge +0.5\sigma$ and an equal-weighted Diffusion Index of $M \ge 50.0$. If a build is concentrated only in high-volume coastal hubs, the index triggers a Divergent Accumulation state, isolating the anomaly.
- Temporal Hysteresis & Persistence Constraint: Transitioning out of an active extreme regime (e.g., Synchronized Inventory Accumulation) back to Noise/Churn requires either crossing a tighter inner boundary ($\pm 0.4\sigma$ hysteresis zone) or maintaining the new state for a minimum of two (2) consecutive reporting cycles before the classification engine registers a state change.
- SYNCHRONIZED INVENTORY ACCUMULATION: $Z_{T1} \ge +0.5\sigma$ AND $M \ge 50.0$. Both volume accumulation intensity and geographic/model breadth are elevated. This synchronized expansion indicates widespread inventory increases across the luxury landscape, historically associated with broad discretionary demand moderation.
- DIVERGENT ACCUMULATION REGIME: $Z_{T1} \ge +0.5\sigma$ AND $M < 50.0$. Total accumulation intensity is elevated, but breadth remains low. This indicates localized or brand-specific listing accumulation (such as regional logistical backlogs or model overproduction) rather than a synchronized broad-market shift.
- NORMALIZED INVENTORY FLOW: $Z_{T1} \le -0.5\sigma$ AND $M \ge 50.0$. Both volume depletion intensity and breadth are elevated. This broad-based drawdown is historically associated with synchronized market clearing and balanced transaction velocity across premium sectors.
- SELECTIVE TRADE-DOWN DYNAMICS: $Z_{T1} \le -0.5\sigma$ AND $M < 50.0$. Overall inventory levels are declining on a volume-weighted basis, but breadth remains low. This asymmetry is consistent with localized inventory normalization, brand-level dealer clearing, or selective model-level substitution patterns.
- NOISE / CHURN (The ELSE Condition): Captures all instances where $Z_{T1}$ is churning within the $-0.5\sigma$ to $+0.5\sigma$ equilibrium band, indicating a stable market equilibrium with normalized weekly fluctuations and no distinct directional trend.
To illustrate this classification in practice with live market data, Figure C.2 shows the empirical phase-space trajectory of the U.S. premium automotive market.
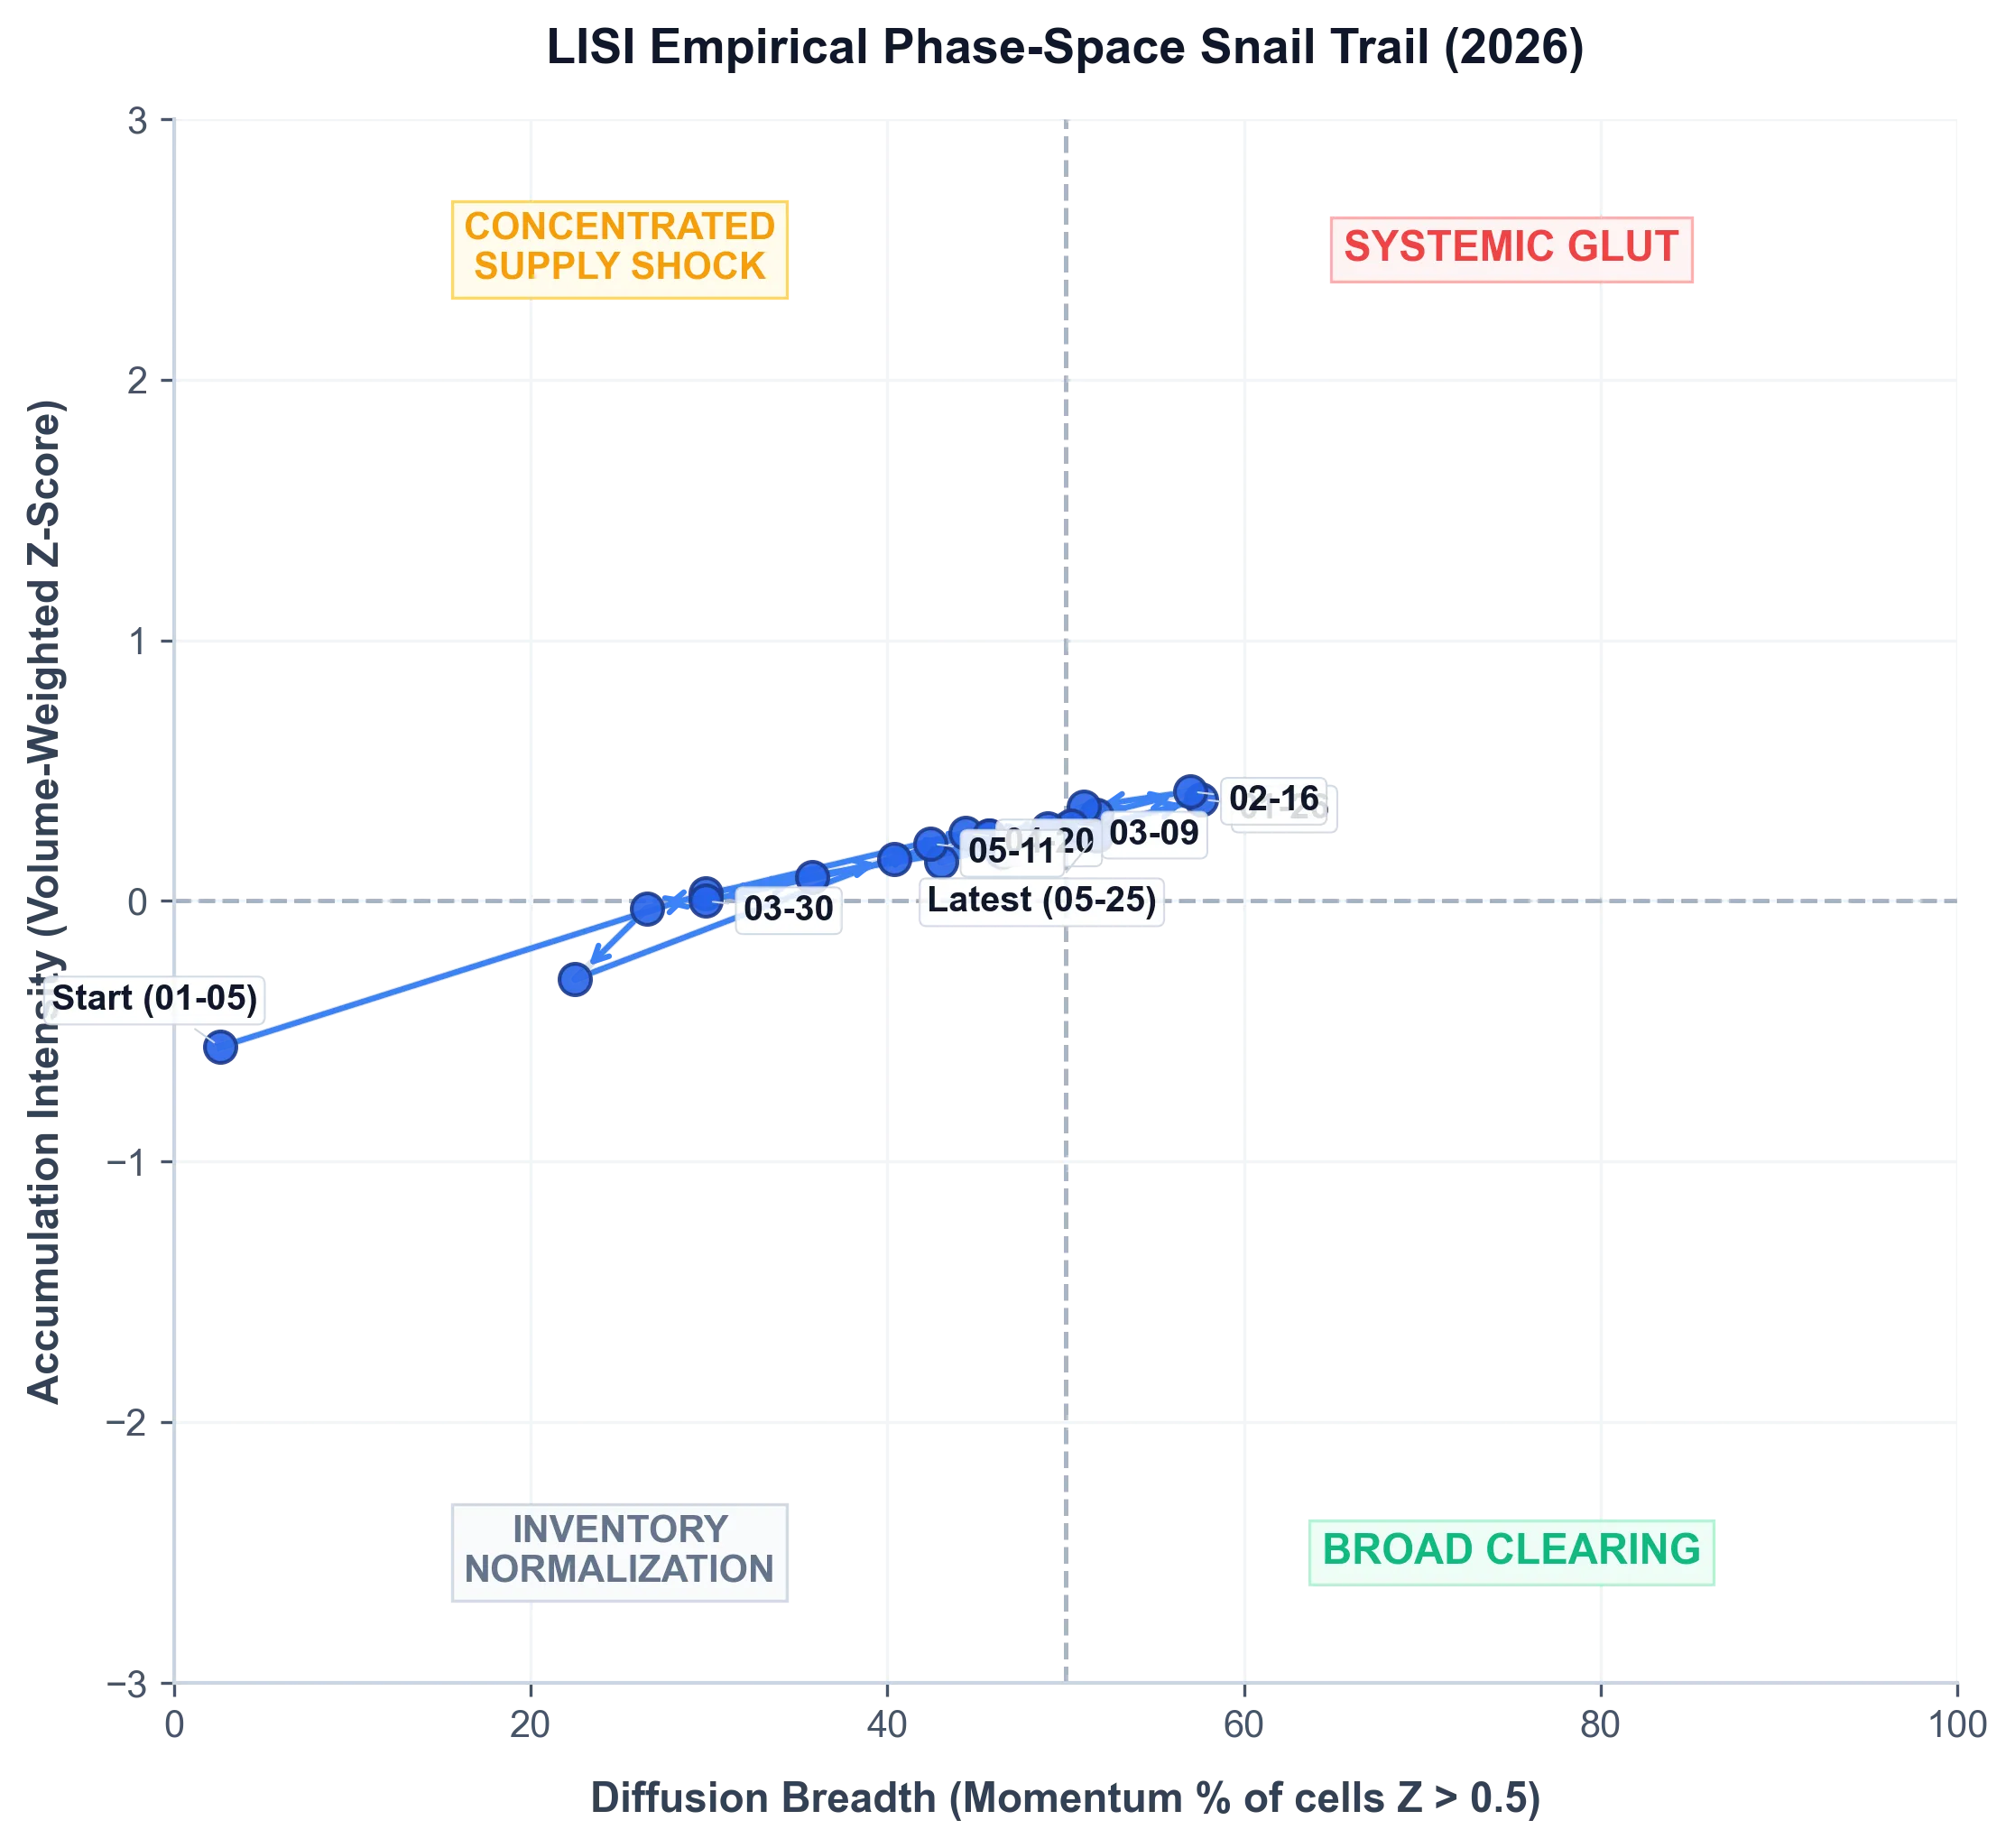
Figure C.2: Empirical Phase-Space Snail Trail (Live Q1 2026 Telemetry) — A supplementary phase-space scatter plot tracing the 6-week chronological vector of the aggregate LISI index. The plotted trajectory demonstrates the real-time migration of market conditions from the equilibrium noise floor into active regime states.
C.4 Regime Transition Indicators (RTI)
While C.2 and C.3 evaluate the static state of the market, the RTI evaluates the vector of the market by tracking week-over-week changes in Accumulation (\Delta Z) and Diffusion (\Delta M) relative to minimum sensitivity thresholds.
- GLUT EXPANDING: $\Delta Z \ge 0.10\sigma$ and $\Delta M \ge 5.0%$. Inventory accumulation is actively compounding and spreading to new panel cells.
- SCARCITY BUILDING: $\Delta Z \le -0.10\sigma$ and $\Delta M \le -5.0%$. Inventory is actively draining out of the network at an accelerating rate.
- FRAGMENTATION INCREASING: $\Delta Z \ge 0.10\sigma$ and $\Delta M \le -5.0%$. Absolute inventory is rising, but participation is narrowing (consolidation into specific regions or models).
- TIGHTENING PHASE: $\Delta Z \le -0.10\sigma$ and $\Delta M \ge 5.0\%$. Widespread inventory clearing with broadening participation.
- STABLE: Directional adjustments fall within noise tolerances; no dominant vector (e.g., |\Delta Z| < 0.10\sigma or |\Delta M| < 5.0%).
C.5 Noise Suppression & Dead-Zone Thresholds
To suppress high-frequency classification jitter and prevent microscopic statistical noise from triggering regime transition vectors, LISI applies a dead-zone threshold filter to week-over-week deltas. Transition vectors in C.4 are activated only when the change in intensity exceeds |\Delta Z| \ge 0.10\sigma and the change in diffusion breadth exceeds |\Delta M| \ge 5%. Variations falling within this threshold band default to the Stable classification, filtering out short-term fluctuations and ensuring that LISI registers only economically meaningful structural shifts.
Appendix D — Metric Calculation Reference
D.1 Baseline & Volatility Floor Constraints (The Anchor)
Rolling Mean: $$\mu_{i,t} = \frac{1}{52} \sum_{k=0}^{51} X_{i, t-k}$$ Empirical Standard Deviation: $$\sigma_{i,t} = \sqrt{\frac{1}{51} \sum_{k=0}^{51} (X_{i, t-k} - \mu_{i,t})^2}$$ Adjusted Standard Deviation (Regularization Floor): $$\sigma_{adj, i, t} = \max(\sigma_{i,t}, c \cdot \mu_{i,t})$$ (Where the regularization coefficient $c$ is set a priori at a conservative parameter of $0.15$ to enforce out-of-sample discipline. This 15% threshold is mathematically defined as a shrinkage-style regularizer bounding sensitivity to sub-resolution wiggles in low-variance panel cells. Operationally, it corresponds to the typical weekly listing and transaction churn rate (12%–18%) in franchised dealer networks. Fluctuations below this threshold represent collection noise, digital ingestion latencies, or shipping delays rather than macro demand shifts. It does not assume historical stationary distribution parameters, but acts as an operational pipeline guardrail to suppress high-frequency collection artifacts during the out-of-sample forward-testing phase).
D.2 Inventory Accumulation (Z-Score)
Cell-Level Z-Score: $$Z_{i,t} = \frac{X_{i,t} - \mu_{i,t}}{\sigma_{adj, i, t}}$$ Tier 1 Volume-Weighted Accumulation ($Z_{T1}$): $$Z_{T1, t} = \sum_{i=1}^{N_{T1}} \left( w_i \cdot Z_{i,t} \right)$$ (Where $w_i$ is the specific cell’s trailing 52-week average inventory volume as a percentage of the total Tier 1 tracking basket).
D.3 Aggregate Diffusion Index (Breadth)
Indicator Function: $$I_{i,t} = 1 \text{ if } Z_{i,t} > +1.0, \text{ else } 0$$ Diffusion Formula: $$D_t = \left( \frac{\sum I_{i,t}}{N_{valid, t}} \right) \times 100$$ (Where $N_{valid, t}$ is the count of all panel cells that successfully passed the data_quality_score threshold for week $t$).
D.4 Sigmoid Scaling Function (The Headline Index)
Accumulation Sigmoid Transformation:
$$S(Z) = \frac{100}{1 + e^{-k \cdot Z_{T1, t}}}$$
(Note: The $k=1.5$ scaling coefficient is set to map the volume-weighted Z-score index to a 0–100 boundary, ensuring that extreme standard deviations of roughly $\pm 3.0\sigma$ reach the sigmoidal asymptotes).
Headline Blending Formula:
$$Headline_t = (w_1 \cdot D_t) + (w_2 \cdot S(Z))$$
(Where weights are structurally balanced at $w_1 = 0.5$ and $w_2 = 0.5$).
D.5 Regime Transition Index (RTI) & Momentum Vectors
Accumulation Delta: $$\Delta Z = Z_{T1, t} - Z_{T1, t-1}$$ Diffusion Delta: $$\Delta D = D_t - D_{t-1}$$ RTI Formula: $$RTI_t = (0.6 \cdot \Delta Z) + (0.4 \cdot \Delta D_{norm})$$ (Where $\Delta D_{norm}$ is the change in diffusion scaled to a compatible unit-variance range).
D.6 Geographic Fragmentation Score (GFS)
GFS Formula: $$GFS_t = \sqrt{ \frac{1}{M} \sum_{m=1}^{M} (Z_{m,t} - \bar{Z}_{national, t})^2 }$$ (Where $M = 10$ core tracked MSAs. A rising $GFS$ indicates K-shaped geographic divergence).
D.7: The Intra-New Substitution Spread
To isolate brand-fatigue from structural macroeconomic stress, the LISI framework tracks the Intra-New Substitution Spread (Tier 1 vs. Defensive mass-market) and the Prestige Gap (Tier 2 vs. Tier 1 luxury segments).
D.7.1 Intra-New Substitution Spread (Tier 1 vs. Defensive Group) This metric calculates the divergence in accumulation rates (Z-score deltas) between the Tier 1 Premium Universe (e.g., BMW X3, Lexus RX) and a benchmark “Defensive Group” of mass-market functional equivalents (e.g., Toyota Grand Highlander, Hyundai Palisades top end trims):
- The “Trade-Down” Regime (Price Resistance): If Tier 1 inventory accumulates ($Z > +0.5$) while the Defensive Group continues to clear at historical norms ($Z < 0$), the spread widens. This is consistent with price sensitivity among mass-affluent buyers, who are maintaining new-vehicle purchases but substituting premium badges for mass-market value.
- The “Systemic Shock” Regime (Demand Destruction): If both Tier 1 and the Defensive Group accumulate simultaneously with a tightening spread, the signal upgrades from “price resistance” to a systemic liquidity or credit shock, suggesting the consumer is deferring all new-duration liabilities regardless of brand tier.
D.7.2 Prestige Gap (Tier 2 vs. Tier 1) To track substitution patterns within the luxury market itself, the framework monitors the spread between volume-weighted Tier 2 (Full Luxury) and Tier 1 (Premium/Near-Luxury) accumulation:
$$Prestige_Spread_t = Z_{T2, t} - Z_{T1, t}$$
- Luxury Tier Trade-Down: A widening positive spread ($Z_{T2} \gg Z_{T1}$) indicates that full luxury platforms (Tier 2) are accumulating relative to Tier 1 premium models. This is consistent with affluent households contracting discretionary budgets but staying within the premium ecosystem by trading down to near-luxury alternatives.
- Synchronized Luxury Contraction: A narrow or contracting spread at high absolute levels ($Z_{T2} > +1.0$ and $Z_{T1} > +1.0$) points to synchronized demand destruction across the entire luxury ecosystem.
D.8: The Prestige Gap
While cross-brand substitution measures broader market shifts, the Prestige Gap isolates price fatigue strictly within the same vehicle platform (e.g., Lexus RX 350 Luxury vs. Lexus RX 350 Base), removing brand-equity variables from the equation.
Spread Formula: $$Spread_t = Z_{Top_Trim, t} - Z_{Low_Trim, t}$$
- Active Trade-Down: Flagged when $Spread_t > +1.0$ AND $Z_{Low_Trim, t} \le +0.5\sigma$. Consistent with mass-affluent consumers rejecting premium optionality while remaining in the premium category.
- Systemic Freeze: Flagged when $Z_{Top_Trim, t} > +1.0\sigma$ AND $Z_{Low_Trim, t} > +1.0\sigma$. Consistent with broad-based inventory accumulation across all price points.
- Methodological Caveat (Captive Finance Subvention): A tightening spread at high absolute inventory levels can occasionally be triggered not by a demand freeze, but by aggressive OEM captive-financing incentives exclusively targeting base-trim leases to move volume. LISI treats this as a systemic stress indicator regardless, as localized OEM subvention is itself a reactive measure to an inability to clear inventory organically.
D.9: Geospatial Basket Stratification
Consumer assignment of premium status and utility varies heavily by geography (e.g., high-trim full-size trucks act as the primary discretionary proxy in Texas MSAs, while premium European imports dominate coastal MSAs). To maintain localized behavioral fidelity without breaking the mathematical cohesion of the national index, LISI utilizes MSA-Stratified Baskets.
Rather than forcing a rigid, universal list of vehicle models across all geographies, LISI curates a locked, MSA-specific basket of ‘Tier 1’ and ‘Defensive’ models based on historical local registration volumes. The framework achieves national standardization by aggregating the first-derivative derivatives (Z-scores) of these local baskets, rather than their nominal unit counts. A standard deviation of accumulation in Houston’s premium truck market is treated mathematically equivalent to a standard deviation of accumulation in San Francisco’s premium SUV market. This ensures the index measures local consumer hesitation against a local baseline, utilizing the Z-score as the universal standardizing ruler.
Appendix E — Methodology Notes & Version Controls
E.1 Pipeline Execution & Temporal Anchoring
To prevent intra-week reporting variance and capture standard dealership reconciliation cycles, the pipeline adheres to a strict dual-measurement temporal schedule.
- Measurement Frequency: The primary data ingestion pipeline executes twice weekly. This dual-acquisition architecture captures intra-week market surface changes and provides a critical defense against temporary platform outages or digital schema drift.
- Aggregation & Presentation Window: While measurements are captured twice weekly, the data is statistically smoothed and aggregated to produce a single weekly panel observation (anchored to Sunday 23:59 EST). This ensures the output remains a stable weekly time-series for macroeconomic tracking while benefiting from the intra-week noise reduction of multiple physical acquisitions.
- Observation Boundaries: A “tracking week” is strictly defined as Monday 00:00 EST through Sunday 23:59 EST.
- Look-Ahead Bias Prevention: Pipeline run timestamps are immutably logged. Crucially, any delayed acquisitions or retroactive platform adjustments that occur after the weekly execution boundary are strictly excluded from the current week’s calculation and dropped. They are never deferred to the subsequent period, definitively preventing artificial volume spikes and mathematical time-smearing.
E.2 Imputation Rules & Sensor Failure Protocols
digitally acquired alternative data is structurally vulnerable to schema drift and IP blocking. The LISI pipeline enforces rigid imputation logic to prevent temporary platform outages from triggering false macroeconomic regimes.
- Data Quality Threshold: If the data_quality_score for a specific source falls below $0.60$, the system triggers a source_outage_flag.
- State-Hold (Forward-Fill) Protocol: During an active outage flag, the pipeline does not impute the historical mean. Instead, it carries forward the last known valid observation count ($X_{t-1}$) for a maximum of two (2) consecutive tracking weeks to prevent artificial mean-reversion.
- Maximum Hold Duration & Equilibrium Override: If the outage persists into week 3, the affected panel cells are transitioned to an Equilibrium Override. Rather than dropping the cells from the denominator (which would induce an artificial mathematical step-function in the Headline Index), the pipeline artificially sets the Z-score of the blinded cells to $0.0$ and flags them as non-participating. This ensures that prolonged data outages strictly dilute the signal toward neutrality, rather than accidentally triggering a false macro regime.
E.3 Holiday Smoothing & Calendar Adjustments
- Anchor Alignment (Shifting Holidays): While fixed-date holidays are naturally absorbed by the 52-week rolling anchor, the pipeline utilizes an Offset-Adjustment for Shifting Holidays (e.g., Thanksgiving, Easter). During these periods, the 52-week look-back ($\mu_{t-52}$) is manually shifted by $\pm 1$ week to ensure that the current promotional window is mathematically evaluated against the exact equivalent promotional window from the prior year.
- Momentum Override: During predefined holiday clearing weeks, week-over-week accumulation velocity shifts ($\Delta Z$) are evaluated using a 14-day smoothed average rather than a strict 7-day delta, preventing a single high-volume holiday weekend from incorrectly triggering a SCARCITY_BUILDING transition regime.
E.4 Version History & Changelog
- V1.0 (Deprecated): Relied on raw nominal inventory counts and estimated days-supply. Deprecated due to vulnerability to listing inflation.
- V1.5 (Deprecated): Introduced initial MSA mapping and Tier filtering. Deprecated because it lacked breadth (diffusion) logic.
- V2.0 (Deprecated): Shifted to standardized derivatives (Z-scores). Introduced Aggregate Diffusion Index, Data Quality Heartbeat, bounded Sigmoid Headline Index, and explicit BEV exclusion.
- V2.1 (Deprecated): Updated field names from “velocity” to “accumulation”.
- V3.0 (Current): Major structural revision. Added mission statement defining LISI as a behavioral observation framework. Elevated behavioral boundaries to dedicated Chapter 2 (What LISI Measures / Does Not Directly Measure / May Become). Added subsection 3.6 (Why Premium Durable Goods?) consolidating the core assumption defense. Replaced “confidence” terminology with “behavior” terminology where epistemically appropriate. Introduced Survey-Behavior Confirmation Matrix (Table 3). Restructured Applications chapter around progressive confidence hierarchy. Migrated all lead-lag and cross-domain claims to new Chapter 9 (Research Hypotheses Under Evaluation) including Hypothesis E (Incremental Information Content). Updated all internal cross-references.
E.5 Universe Maintenance & Rebalancing
The underlying model tracked universe is not continuously floating; it is structurally locked to preserve the time-series.
- Review Schedule: September of each calendar year, aligned with OEM model-year rollovers.
- Rebalancing Logic: Models may be downgraded or excluded if lease penetration drops below demographic thresholds, or if standard MSRP bands drift structurally out of the defined discretionary comfort window ($45,000 – $75,000 baseline, adjusted for inflation).
- Ad-Hoc Discontinuation Protocol: If an OEM officially ceases production of a tracked model mid-cycle, or if a model’s national inventory volume falls below 5% of its historical mean for 4 consecutive weeks, it is immediately deprecated to prevent “ghost cells” from dragging down the Aggregate Diffusion Index.
Appendix F — Citations & Structural Endnotes
- Toyota Motor North America. (2026, January 5). Full Year 2025 U.S. Sales Results. [Data set indicating sales volume for premium and co-developed crossovers].
- California Energy Commission & DMV. (2026). Zero Emission Vehicle and New Vehicle Registration Statistics. [California new registrations indicating ZEV/EV market share contracted to ~13.7% in Q1 2026, with ICE and traditional hybrids commanding over 61% of total registrations].
- Washington State Department of Transportation (WSDOT). (2024, December 31). Gray Notebook: Electric Vehicles. [Washington State EV Market Share (H2 2024): >20%. Total Registered EVs: 223,995 units].
- Alliance for Automotive Innovation. (2025, February). Get Connected Electric Vehicle Quarterly Report Q4 2024. [State-by-State EV Market Share: CA, WA, CO exceed 20%].
- Transportation Energy Institute. (2026, March 5). EV Consumer Behavior and Market Outlook. [Primary EV Demographic Profile: HHI > $150,000].
- J.D. Power. (2025). U.S. Automotive Media and Marketing Report. [Lexus RX Buyer Profile: Median HHI $155,000–$161,000; Demographic Alignment: Mass-Affluent].
- Hedges & Company. (2025). Automotive Market Research and Vehicle Demographics. [BMW Core Tier-1/X3 Buyer Profile: Median HHI $116,000–$125,000].
- Experian Automotive. (2025, Q4). State of the Automotive Finance Market Report. [Premium Luxury Financing: Lease penetration historically averages 50%–55%, indicating high sensitivity to duration financing].
- Federal Reserve Bank of New York. (n.d.). Survey of Consumer Expectations (SCE). [Focuses on forward-looking inflation expectations, household finance projections, and credit access perceptions; provides a high-speed but “soft data” view of consumer expectations].
- Federal Reserve Economic Data (FRED). (n.d.). Total Vehicle Sales (TOTALSA). [Autodata/Wards Intelligence reporting lag; days-supply estimates often lag toward month-end].
- Federal Reserve Economic Data (FRED). (n.d.). Domestic Auto Inventories (AUINVD). [Compiled by the BEA; data typically suffers a minimum 30-to-45-day structural reporting lag].
- Federal Reserve Economic Data (FRED). (n.d.). Consumer Credit G.19 (MVLOAS). [The Federal Reserve officially releases this report on the fifth business day of the second month following the reference month, creating a 35+ day lag].
- S&P Global Mobility / Experian. (n.d.). Vehicle Registrations. [Due to fragmented state DMV processing, physical title records inherently operate on a 60-to-90-day lag before yielding actionable macro data].
- Car and Driver. (2026). Lexus TX vs. Toyota Grand Highlander. [Editorial comparison analysis of co-developed three-row crossover segments].
- CarsDirect. (2024). Toyota Grand Highlander vs. Lexus TX. [Consumer buying guide and platform substitution comparison].